Fig. 9
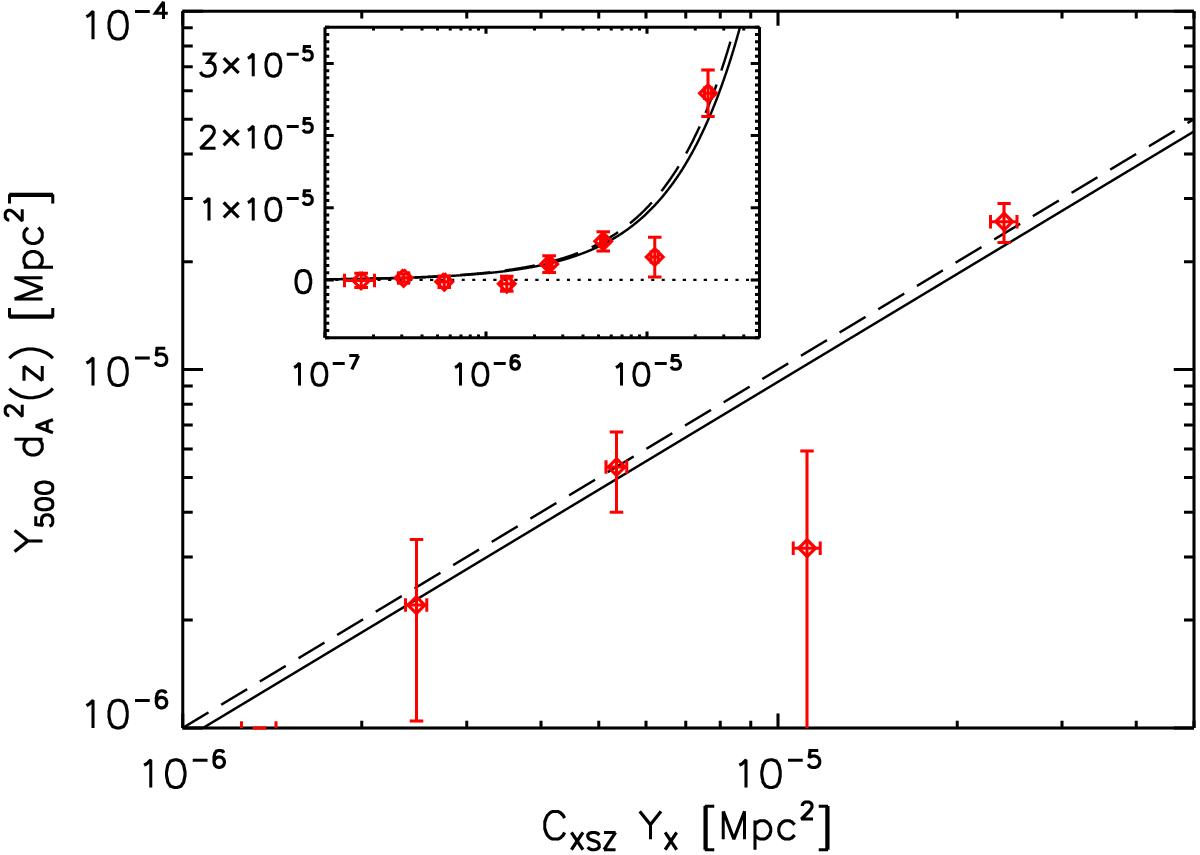
Planck SZ flux ![]() versus YX,500 for the XXL-100-GC sample (red diamonds). The expected value 0.924 (Eq. (19) in Arnaud et al. 2010) is the solid black line and the unity is shown as the dashed line. The inset presents the same data points in the lin-log plane to show also the low YX,500 bins. The numerical values and error bars for the 8 points are given in Table 2.
versus YX,500 for the XXL-100-GC sample (red diamonds). The expected value 0.924 (Eq. (19) in Arnaud et al. 2010) is the solid black line and the unity is shown as the dashed line. The inset presents the same data points in the lin-log plane to show also the low YX,500 bins. The numerical values and error bars for the 8 points are given in Table 2.
Current usage metrics show cumulative count of Article Views (full-text article views including HTML views, PDF and ePub downloads, according to the available data) and Abstracts Views on Vision4Press platform.
Data correspond to usage on the plateform after 2015. The current usage metrics is available 48-96 hours after online publication and is updated daily on week days.
Initial download of the metrics may take a while.