Fig. 7
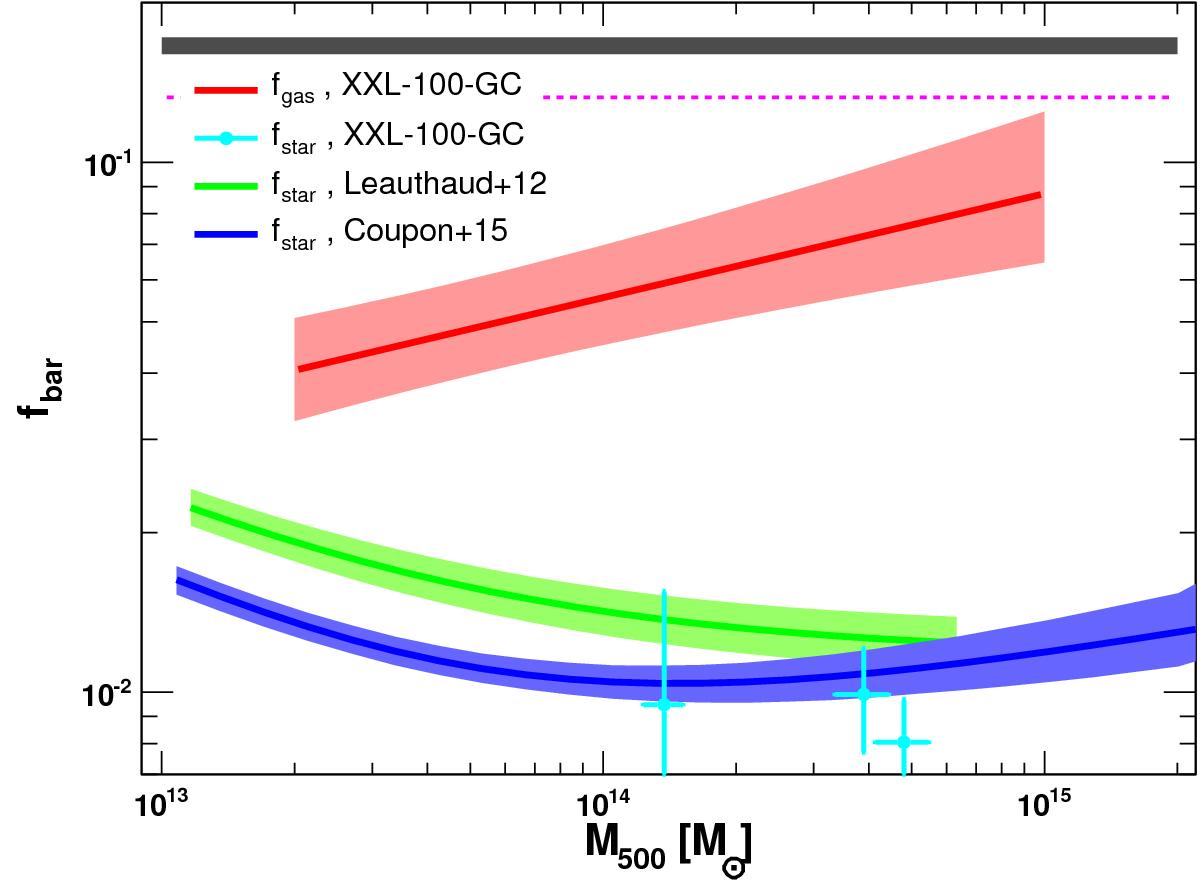
Baryon fraction in the form of hot gas (red, this work) and stars. The cyan data points show the measurements obtained for the XXL-100-GC sample in three temperature bins (see Table 1), compared to literature measurements at different redshifts (z ~ 0.3, Leauthaud et al. 2012, green; z ~ 0.8, Coupon et al. 2015, blue). The WMAP9 cosmic baryon fraction is displayed in the grey shaded area, whereas the dashed magenta line indicates the cosmic baryon fraction corrected by the depletion factor Yb = 0.85 at r500 (Planelles et al. 2013).
Current usage metrics show cumulative count of Article Views (full-text article views including HTML views, PDF and ePub downloads, according to the available data) and Abstracts Views on Vision4Press platform.
Data correspond to usage on the plateform after 2015. The current usage metrics is available 48-96 hours after online publication and is updated daily on week days.
Initial download of the metrics may take a while.