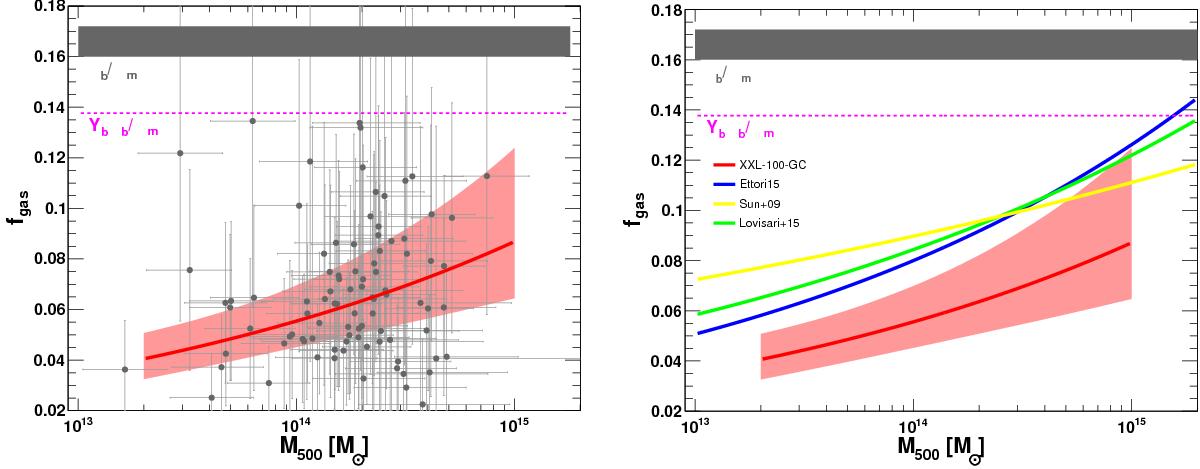
Fig. 4

Relation between gas fraction and halo mass within r500,MT for the XXL-100-GC sample. Left: the red line and the red shaded area show the best-fit relation and its uncertainty. The data points show the individual fgas estimates obtained using the M−T relation. The WMAP9 cosmic baryon fraction is displayed in the grey shaded area, whereas the dashed magenta line indicates the cosmic baryon fraction corrected by the depletion factor Yb = 0.85 at r500 (Planelles et al. 2013). Right: same as in the left panel. For comparison, the solid curves show similar relations obtained using hydrostatic masses (yellow, Sun et al. 2009; blue, Ettori 2015; green, Lovisari et al. 2015).
Current usage metrics show cumulative count of Article Views (full-text article views including HTML views, PDF and ePub downloads, according to the available data) and Abstracts Views on Vision4Press platform.
Data correspond to usage on the plateform after 2015. The current usage metrics is available 48-96 hours after online publication and is updated daily on week days.
Initial download of the metrics may take a while.


