Fig. 3
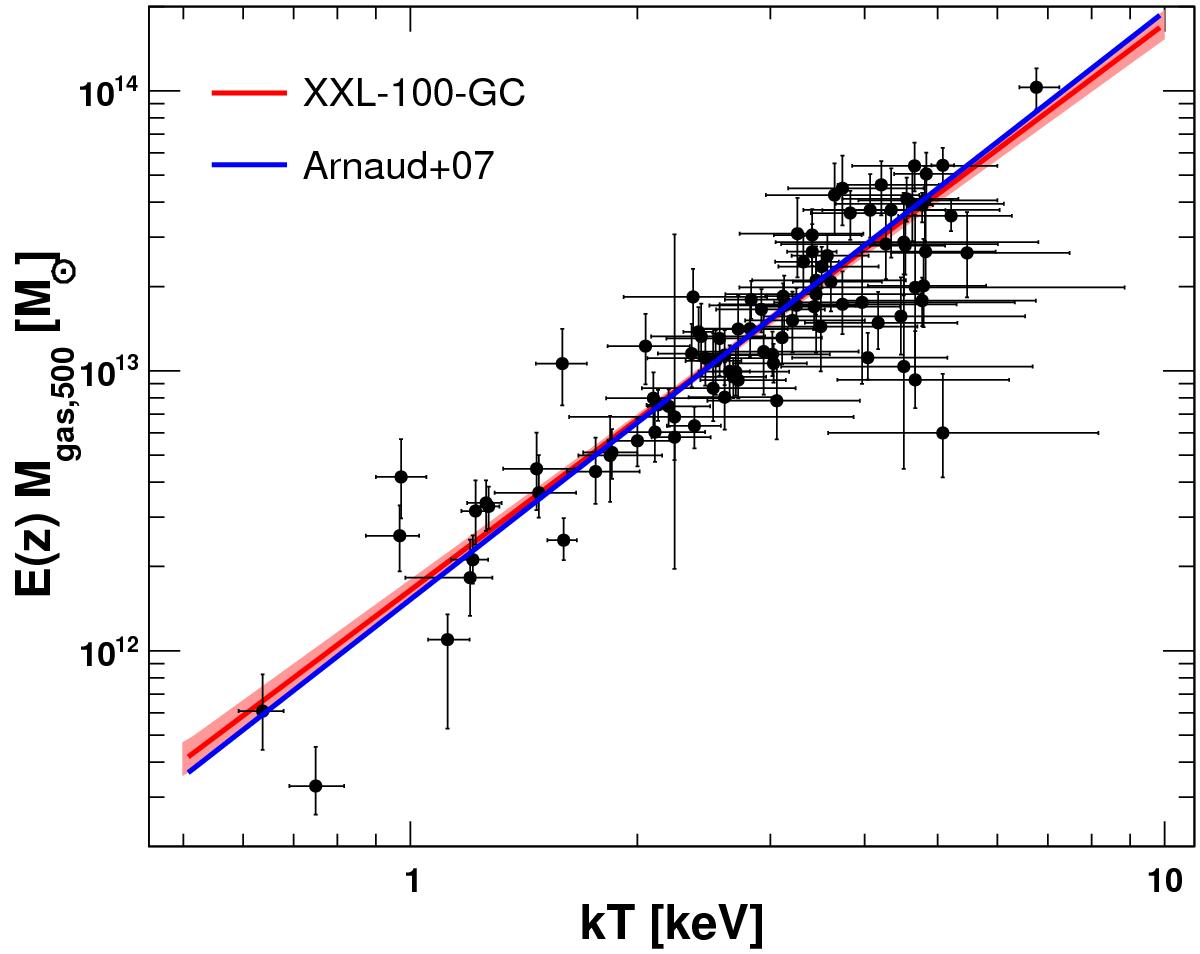
Gas mass within r500,MT for the XXL-100-GC sample as a function of their temperature within a fixed aperture of 300 kpc. The red line and the red shaded area show the best-fit relation and its uncertainty. The blue curve represents the relation of Arnaud et al. (2007).
Current usage metrics show cumulative count of Article Views (full-text article views including HTML views, PDF and ePub downloads, according to the available data) and Abstracts Views on Vision4Press platform.
Data correspond to usage on the plateform after 2015. The current usage metrics is available 48-96 hours after online publication and is updated daily on week days.
Initial download of the metrics may take a while.