Fig. 11
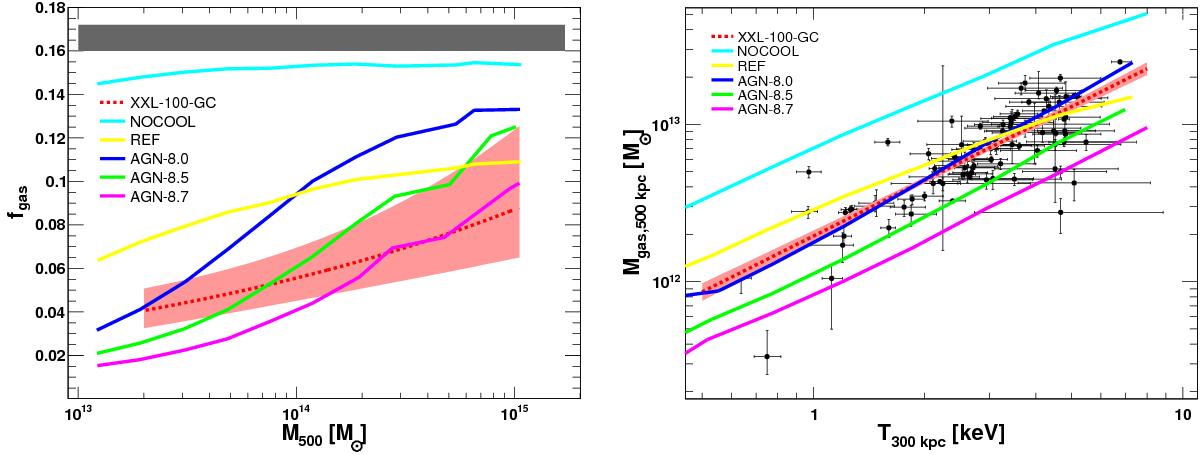
Left panel: gas fraction of XXL-100-GC galaxy clusters (dashed red curve and red shaded area) compared to cosmo-OWLS simulations with different gas physics (non-radiative, NOCOOL; cooling and star formation, REF; AGN feedback with various energy injection, AGN-8.0, AGN-8.5, AGN-8.7). The grey shaded area shows the WMAP9 cosmic baryon fraction. Right panel: gas mass within 500 kpc as a function of the temperature inside 300 kpc for the XXL-100-GC sample (black points) compared to cosmo-OWLS simulations (same colour code). The red dashed curve and shaded area show the best fit to the data with a power law and its error envelope.
Current usage metrics show cumulative count of Article Views (full-text article views including HTML views, PDF and ePub downloads, according to the available data) and Abstracts Views on Vision4Press platform.
Data correspond to usage on the plateform after 2015. The current usage metrics is available 48-96 hours after online publication and is updated daily on week days.
Initial download of the metrics may take a while.