Fig. 7
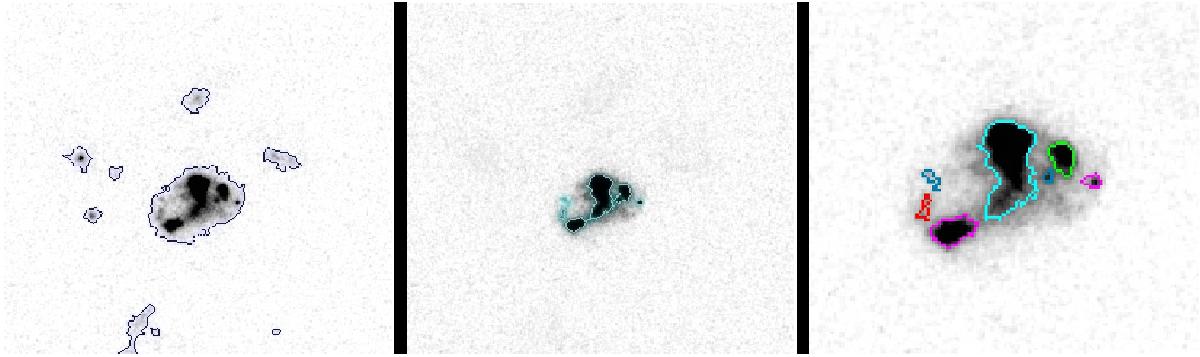
F814W HST/ACS images. Example of the procedure to identify SF knots. Left: first isophotal analysis, where the principal objects in the image are defined. Middle: second isophotal analysis of the target galaxy, where substructures are found. Right: a zoom of the image in the middle. Regions with a radius bigger or equal to the PSF (0.09′′) will be identified as subregions or knots. For clarity the detected regions are shown with different colors.
Current usage metrics show cumulative count of Article Views (full-text article views including HTML views, PDF and ePub downloads, according to the available data) and Abstracts Views on Vision4Press platform.
Data correspond to usage on the plateform after 2015. The current usage metrics is available 48-96 hours after online publication and is updated daily on week days.
Initial download of the metrics may take a while.