Fig. 4
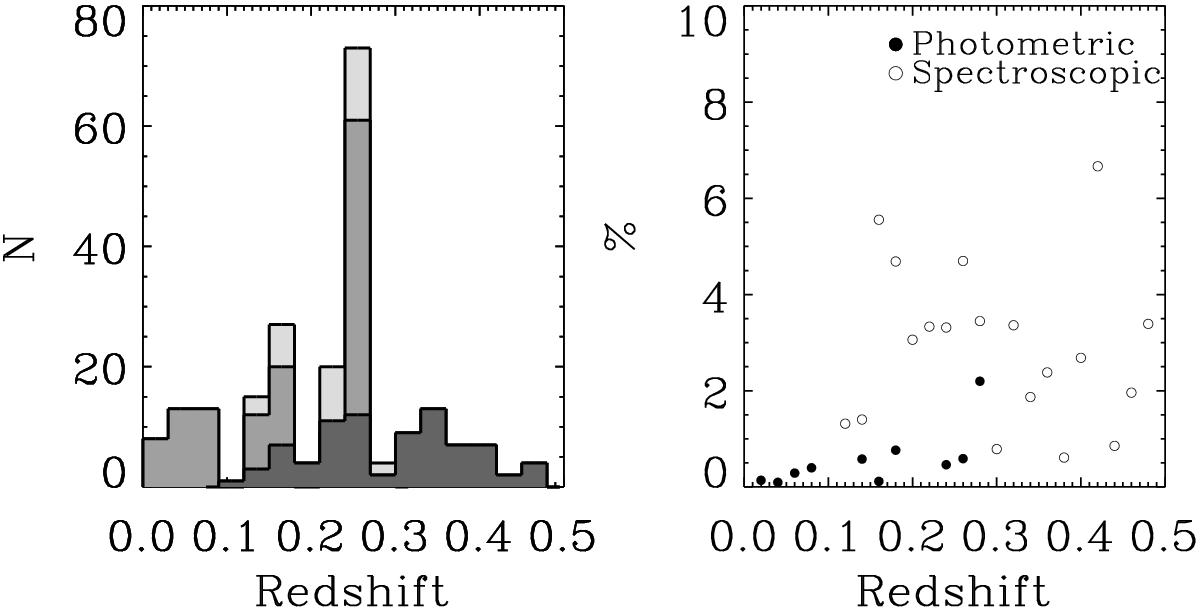
Left: redshift distribution of the photometric (gray), spectroscopic (dark gray) and total (light gray) sample. Right: percentage of starburst galaxies found in COSMOS, with respect to the total analyzed galaxies in different redshifts. The photometric sample is shown with filled circles, and the spectroscopic sample with open circles.
Current usage metrics show cumulative count of Article Views (full-text article views including HTML views, PDF and ePub downloads, according to the available data) and Abstracts Views on Vision4Press platform.
Data correspond to usage on the plateform after 2015. The current usage metrics is available 48-96 hours after online publication and is updated daily on week days.
Initial download of the metrics may take a while.