Fig. 2
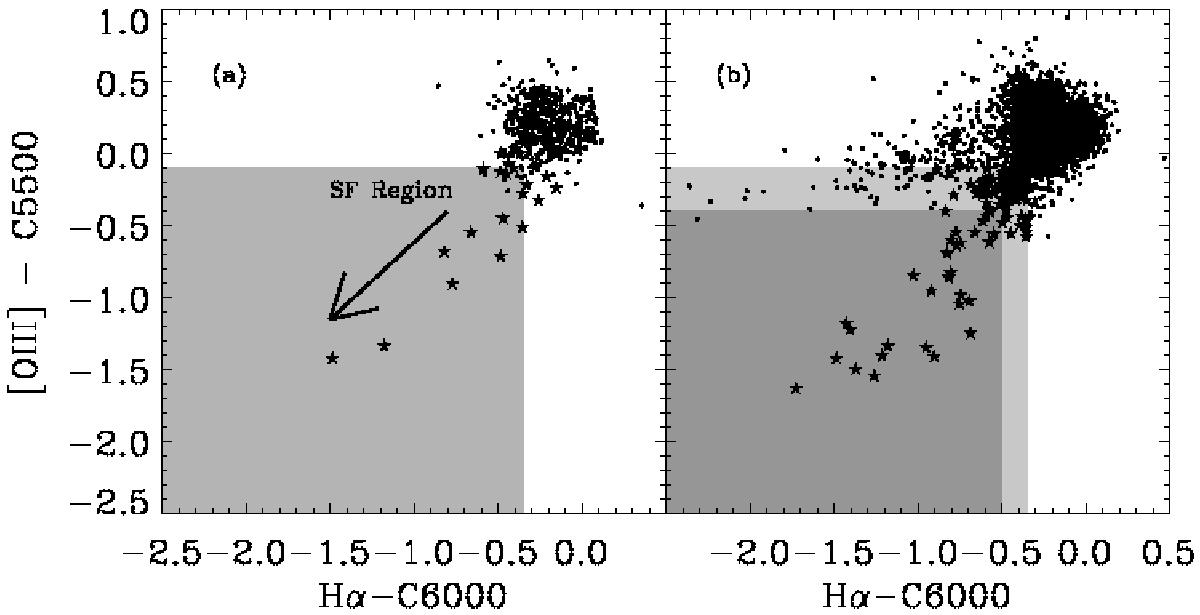
a) Color−color diagram of the 580 galaxies in zCOSMOS measured with SUBARU filters. Star e show the galaxies with EW ≥ 80 Å in both Hα and [OIII]. The arrow points in the direction of galaxies with larger EW in both emission lines. The shadowed region in the diagram is the starburst location. b) Color−color diagram for galaxies in the photometric redshift catalogue, in the redshift ranges: 0.007 ≤ z ≤ 0.074, 0.124 ≤ z ≤ 0.177, and 0.230 ≤ z ≤ 0.274. Star symbols show the galaxies in the star-forming region defined in panel a). We discarded galaxies with high Hα and low [OIII] emission. A subregion (darker shadow) shows the loci in which the photometric EW in Hα and [OIII] is larger than 80 Å for the photometric sample.
Current usage metrics show cumulative count of Article Views (full-text article views including HTML views, PDF and ePub downloads, according to the available data) and Abstracts Views on Vision4Press platform.
Data correspond to usage on the plateform after 2015. The current usage metrics is available 48-96 hours after online publication and is updated daily on week days.
Initial download of the metrics may take a while.