Fig. 17
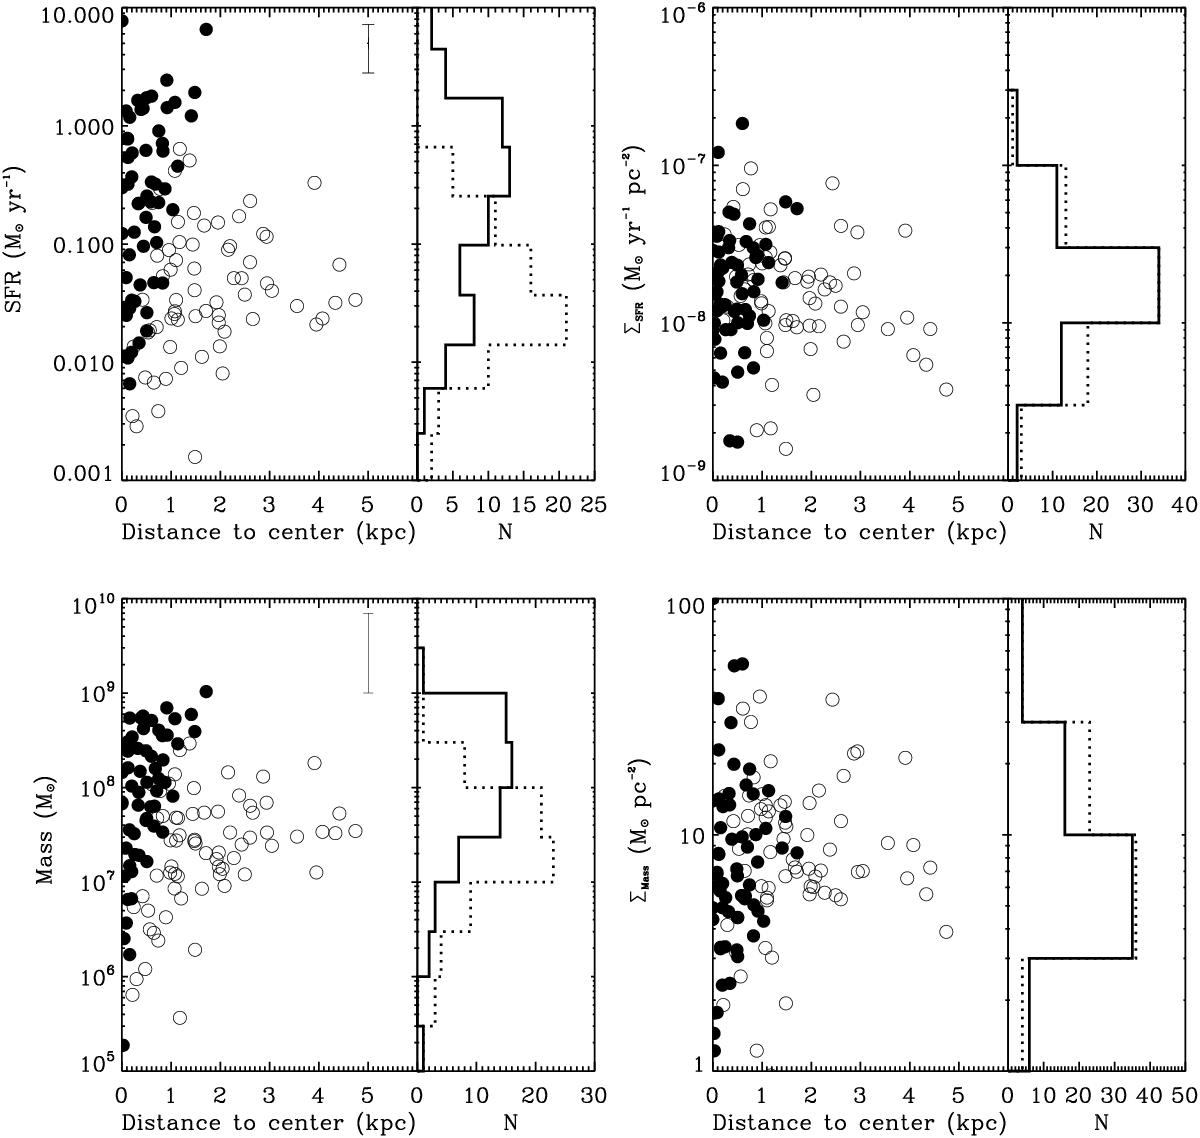
SFR and ΣSFR versus galactocentric distance (top), and mass and Σmass versus galactocentric distance (bottom). Filled circles are centered and lopsided knots and open circles represent offcenter knots. The distribution of each quantity in the y-axis is shown at the right of each panel, solid line is for centered and lopsided knots, and dotted line is for offcenter knots. As can be seen, the most massive and high star-forming regions are in the central part of the host galaxies. For the sake of clarity, Sknots have not been displayed.
Current usage metrics show cumulative count of Article Views (full-text article views including HTML views, PDF and ePub downloads, according to the available data) and Abstracts Views on Vision4Press platform.
Data correspond to usage on the plateform after 2015. The current usage metrics is available 48-96 hours after online publication and is updated daily on week days.
Initial download of the metrics may take a while.