Fig. 7
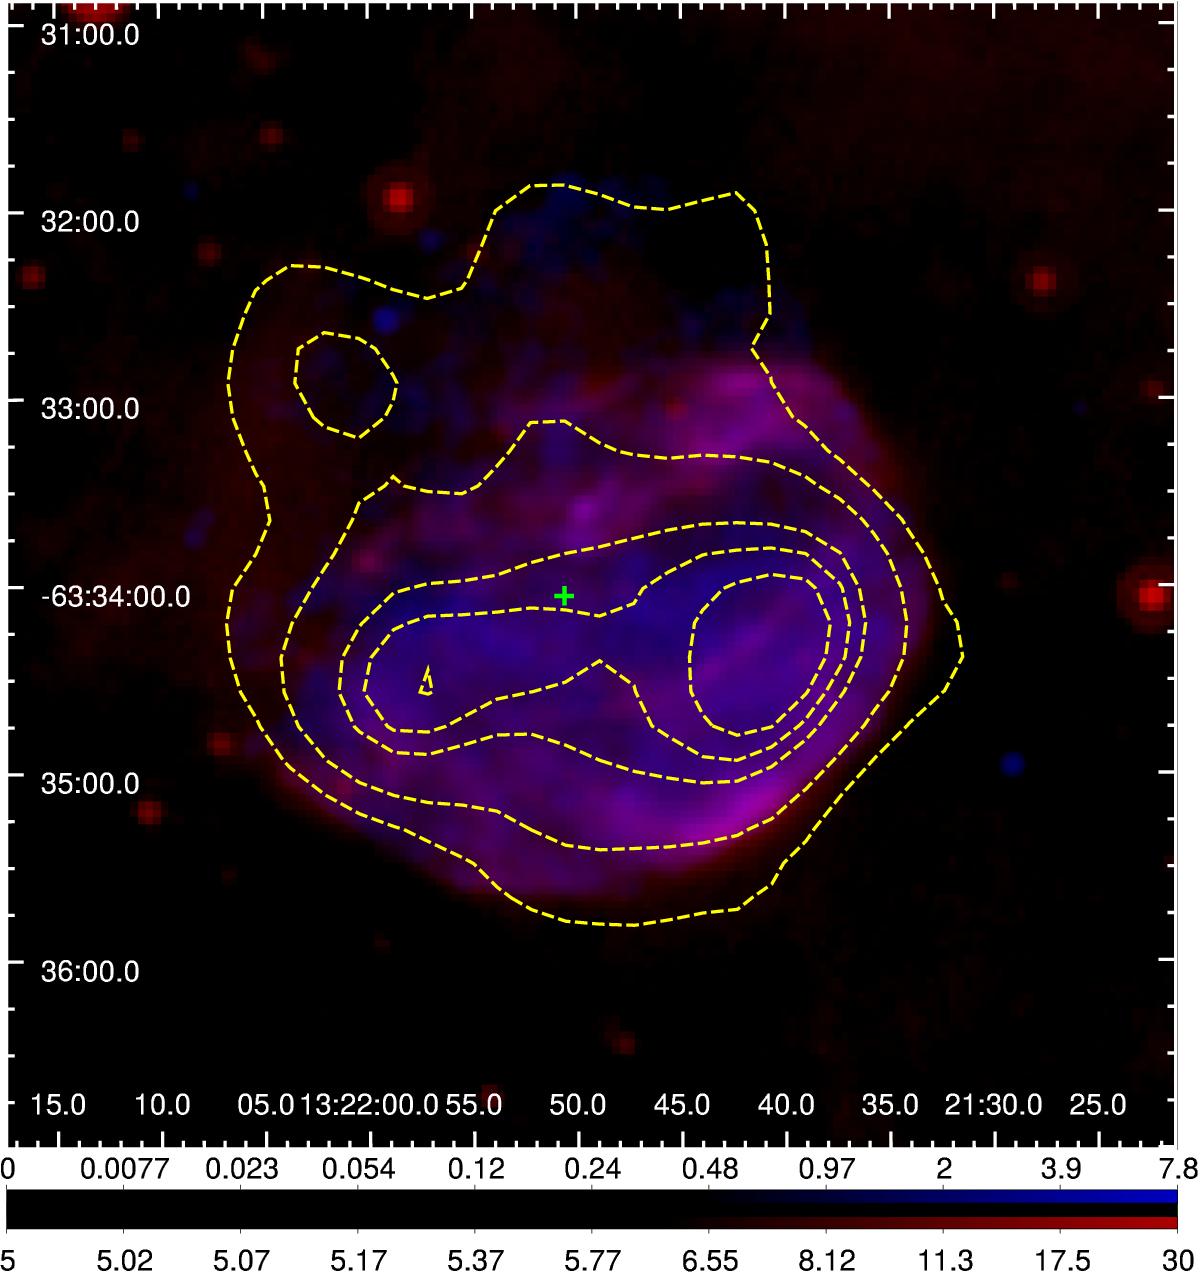
Composite image of the radio (dotted yellow contours), IR (red color) from MIPS-Spitzer in mJy sr-1 and X-ray (blue color) emission of SNR G306.3−0.9. The green cross indicates the IR centroid of the SNR, used in the PRM analysis (see text for details). Horizontal and vertical axes are labeled using J2000.0 right ascension and declination.
Current usage metrics show cumulative count of Article Views (full-text article views including HTML views, PDF and ePub downloads, according to the available data) and Abstracts Views on Vision4Press platform.
Data correspond to usage on the plateform after 2015. The current usage metrics is available 48-96 hours after online publication and is updated daily on week days.
Initial download of the metrics may take a while.