Fig. 6
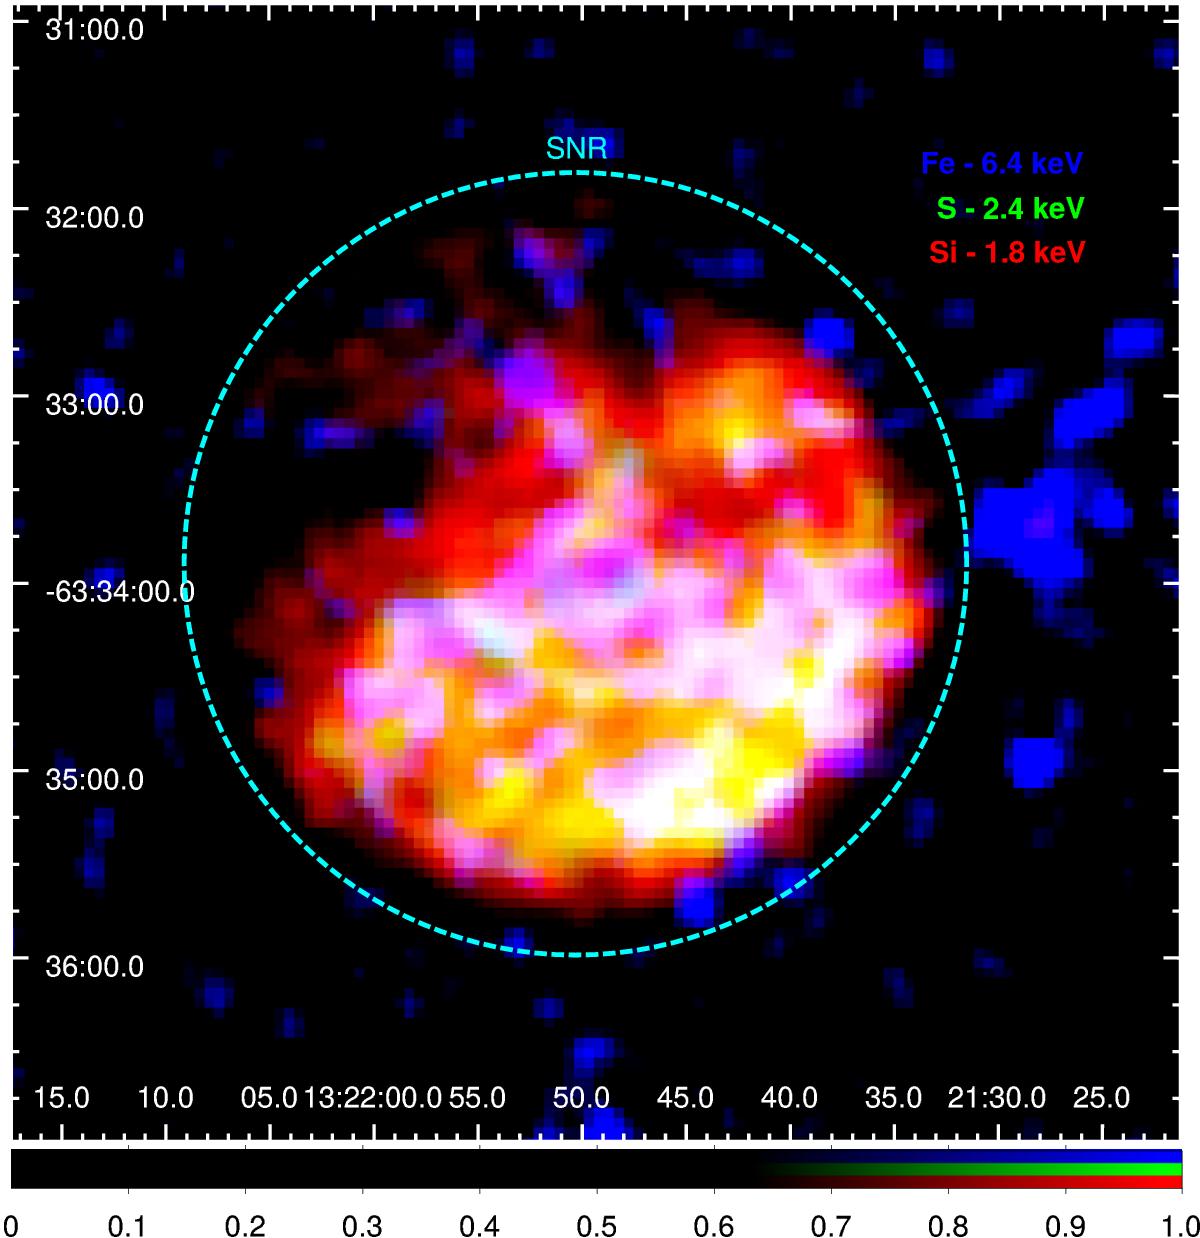
Equivalent width maps obtained from the merged EPIC event files of the XMM-Newton for Si XIII (1.85 keV, in red), S XV (2.4 keV, in green) and Fe-K (6.4 keV, in blue). Cyan contour indicates the peripheral edge of total X-ray emission of G306.3−0.9. Horizontal and vertical axes are labeled using J2000.0 right ascension and declination.
Current usage metrics show cumulative count of Article Views (full-text article views including HTML views, PDF and ePub downloads, according to the available data) and Abstracts Views on Vision4Press platform.
Data correspond to usage on the plateform after 2015. The current usage metrics is available 48-96 hours after online publication and is updated daily on week days.
Initial download of the metrics may take a while.