Fig. 2
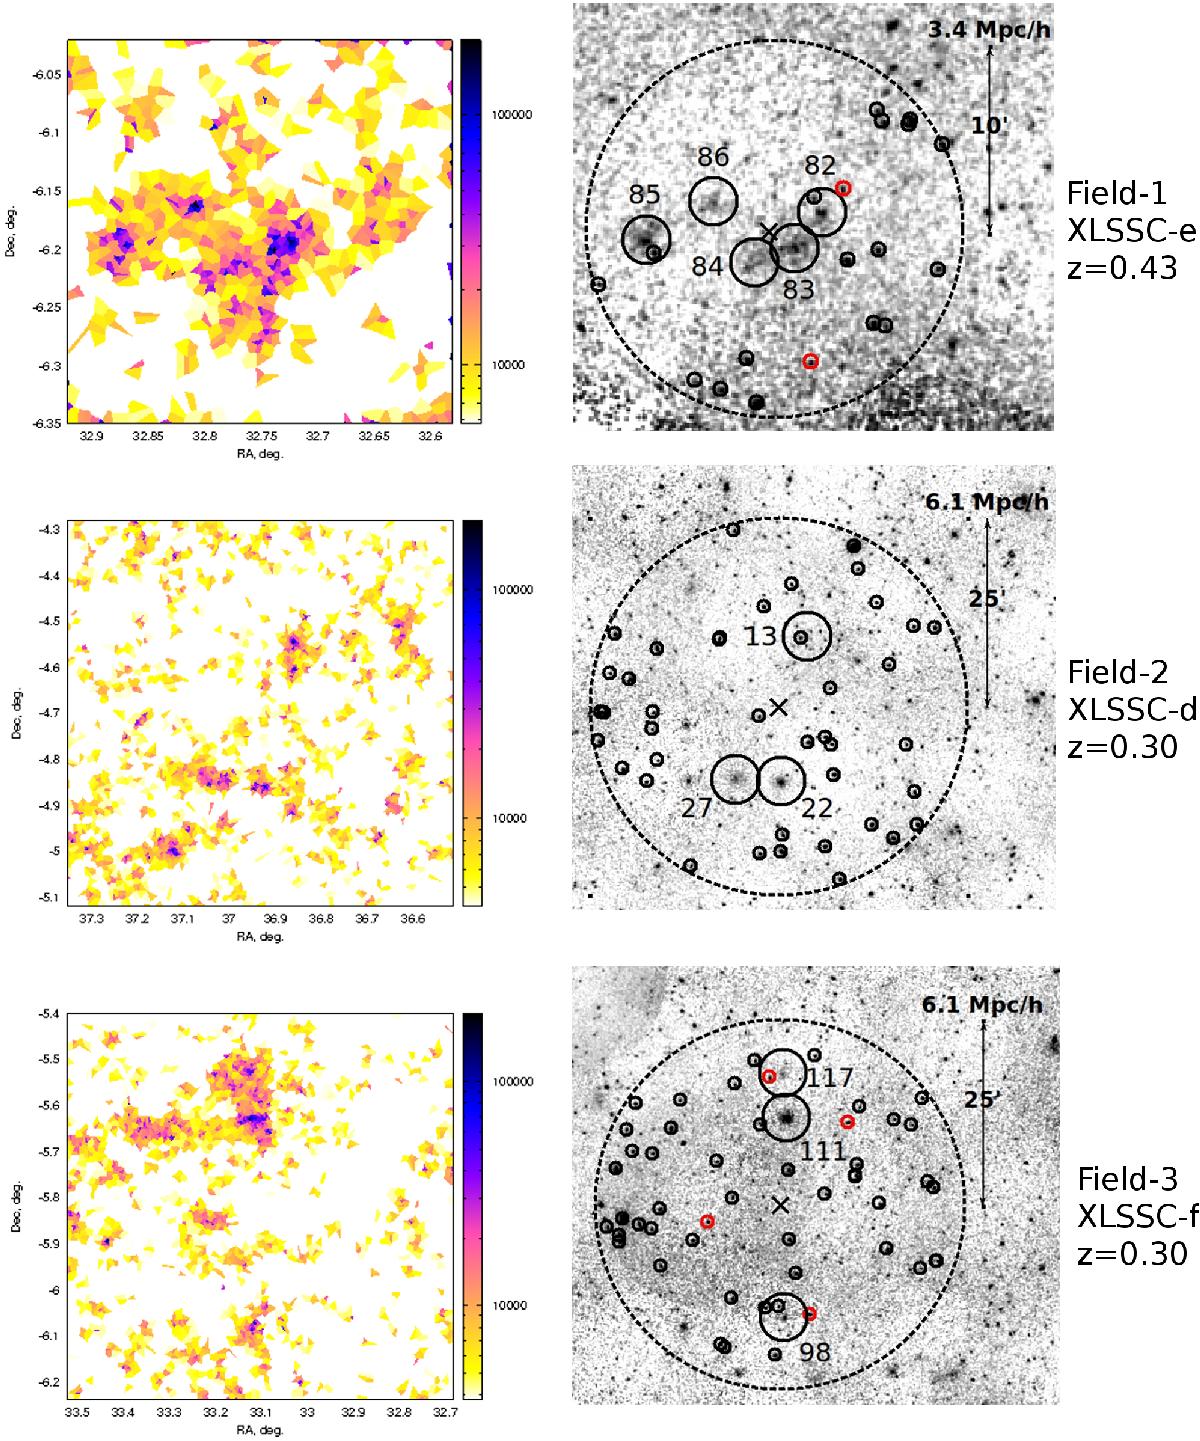
Voronoi tessellations (VT) and X-ray images of the three superclusters (XLSSC-e: top, XLSSC-d: middle, XLSSC-f: bottom). Left panels: Voronoi tessellation using CFHTLS photometric redshift data. All galaxies within δz = ± 0.05 of the supercluster redshift are included. The side bar illustrates the colour-coding of the galaxy number-density. Only areas above the average number-density are coloured in the plots. Right panels: the corresponding X-ray maps overplotted with the positions of the studied areas (dashed circles) and of the X-ray detected clusters (large black circles with XLSSC ID numbers). The small black circles denote X-ray point-like sources above the luminosity limit (L(0.5−2keV) > 2.7 × 1042 erg s-1), while the red circles denote the ones with spectroscopic redshift consistent with the supercluster (within 2 × δz, see Sect. 4.1.2). The supercluster centres are marked with an X. The scale of the VT plots and their corresponding X-ray images is the same. The X-ray clusters can be easily identified in the high-density areas of the Voronoi plots. In the VT plots of XLSSC-d and XLSSC-f at least one more non-X-ray-detected overdensity can be seen, probably below the detection limit of the XXL Survey.
Current usage metrics show cumulative count of Article Views (full-text article views including HTML views, PDF and ePub downloads, according to the available data) and Abstracts Views on Vision4Press platform.
Data correspond to usage on the plateform after 2015. The current usage metrics is available 48-96 hours after online publication and is updated daily on week days.
Initial download of the metrics may take a while.