Fig. 10
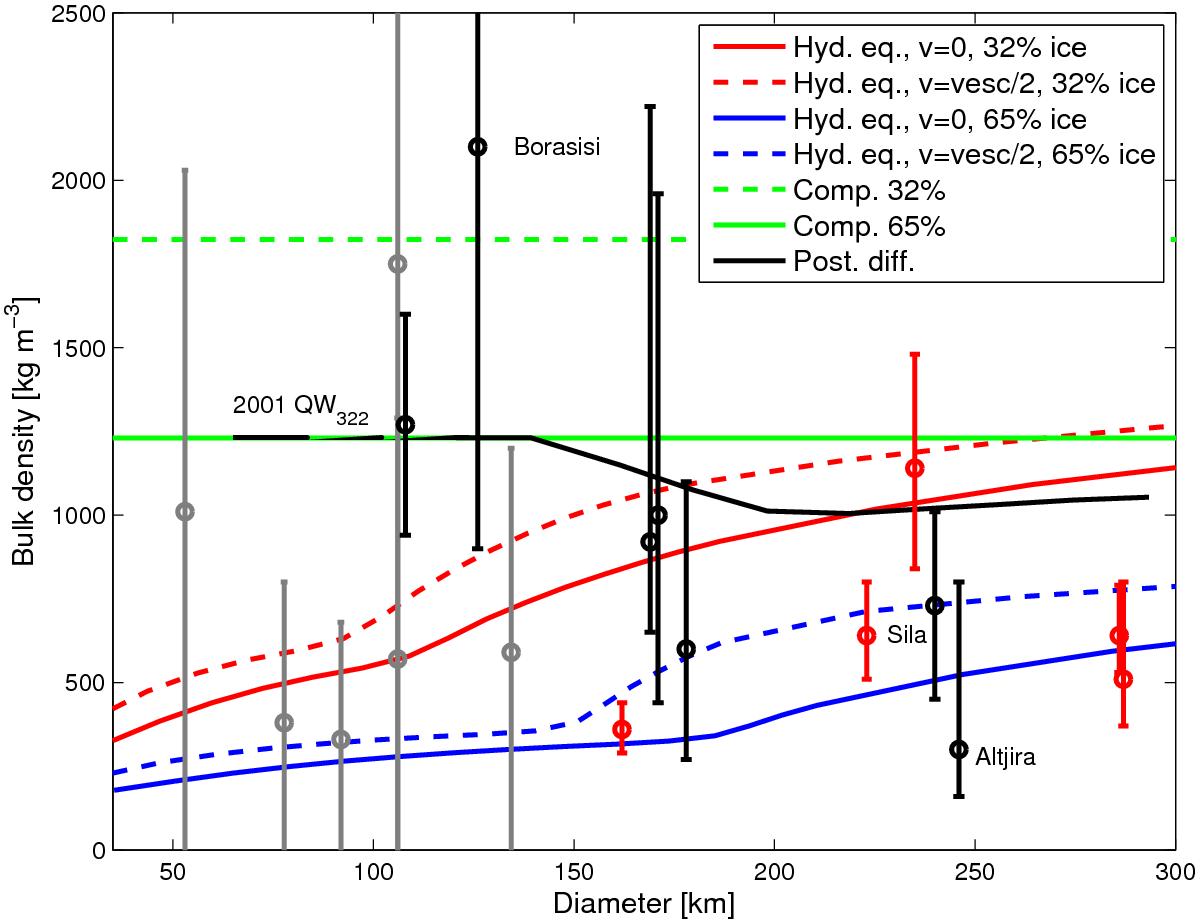
Red and blue curves: hydrostatic equilibrium bulk porosities for composition A (32% ice) and B (65% ice). The solid curves assume vcoll = 0 and the dashed assume vcoll = vesc/ 2. The green lines are the fully compressed densities. The black curve is obtained after thermal processing of bodies with 65% ice formed with vcoll = vesc/ 2. Measured densities for dynamically cold classical disk objects (black, gray) are taken from Petit et al. (2008), Vilenius et al. (2012, 2014), and Carry (2012) based on Grundy et al. (2009, 2013). Densities for dynamically hot classical disk objects, SD objects, and Centaurs (red) are taken from Spencer et al. (2006), Benecchi et al. (2010), Mommert et al. (2012), Santos-Sanz et al. (2012), and Vilenius et al. (2014).
Current usage metrics show cumulative count of Article Views (full-text article views including HTML views, PDF and ePub downloads, according to the available data) and Abstracts Views on Vision4Press platform.
Data correspond to usage on the plateform after 2015. The current usage metrics is available 48-96 hours after online publication and is updated daily on week days.
Initial download of the metrics may take a while.