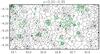
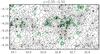
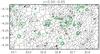
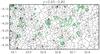
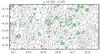
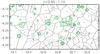
Fig. 5

Voronoi tessellation diagrams of the region encompassing the five westernmost X-ray clusters (RA: 32.52, 33.13, Dec: –6.38, –6.05) as a function of redshift (0.2 <z< 1.1) with Voronoi polygons shown with lines and isophotes of X-ray surface brightness in contours. Each polygon contains only one galaxy, indicated by a black dot. The largest number of sources in the region of X-ray emissions are located in the redshift range 0.35 <z< 0.50. The levels of the X-ray contours are shown in green at 5.28, 7.02, 12.54 and 30 cts s-1 deg -2 in the [0.5−2.5] keV range.
Current usage metrics show cumulative count of Article Views (full-text article views including HTML views, PDF and ePub downloads, according to the available data) and Abstracts Views on Vision4Press platform.
Data correspond to usage on the plateform after 2015. The current usage metrics is available 48-96 hours after online publication and is updated daily on week days.
Initial download of the metrics may take a while.