Fig. 14
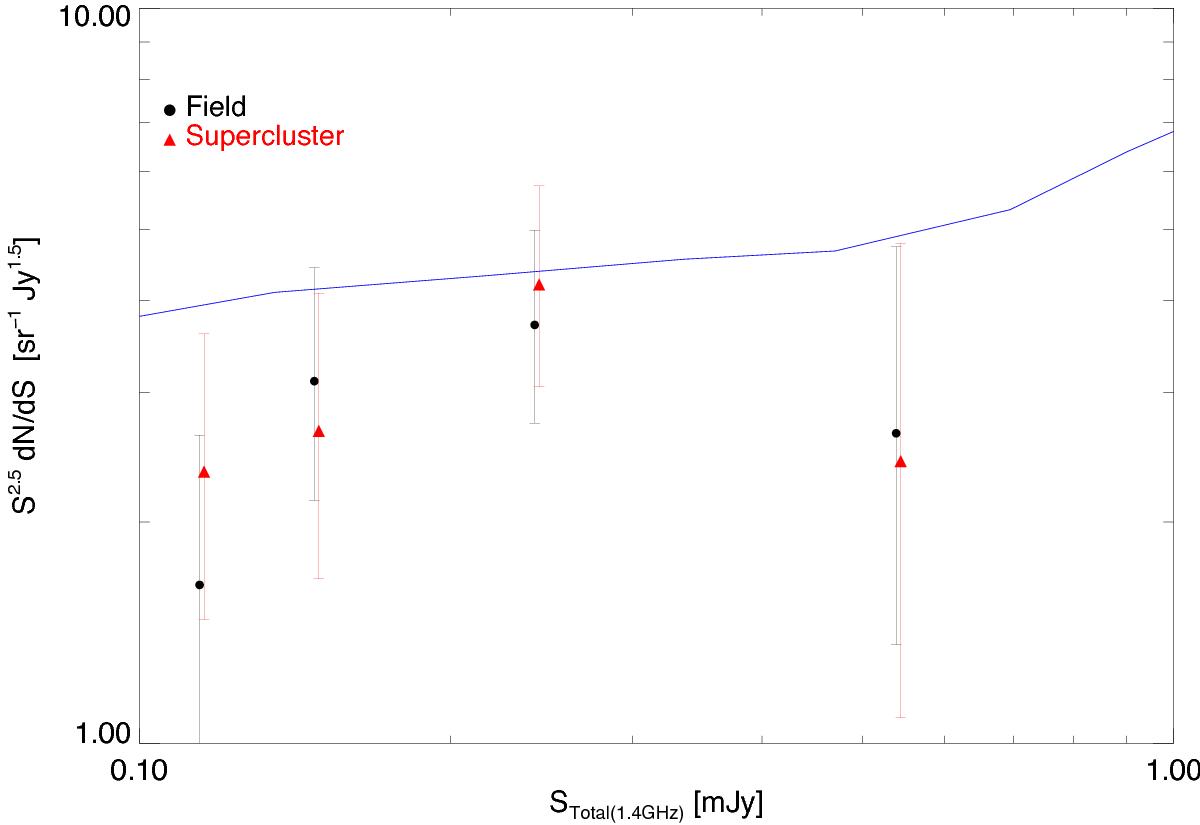
1.4 GHz radio source counts for the supercluster area (red triangles), and the field with good rms excluding the supercluster area (black). Red dots are slightly offset from the bin centres for better visualisation. Errors are Poissonian, calculated using approximate algebraic expressions from Gehrels (1986). Radio source counts from Condon et al. (2012) are shown by the blue line. The flux densities at 1.4 GHz were calculated from the 3 GHz fluxes assuming a spectral index of − 0.7 for consistency with Condon et al. (2012).
Current usage metrics show cumulative count of Article Views (full-text article views including HTML views, PDF and ePub downloads, according to the available data) and Abstracts Views on Vision4Press platform.
Data correspond to usage on the plateform after 2015. The current usage metrics is available 48-96 hours after online publication and is updated daily on week days.
Initial download of the metrics may take a while.