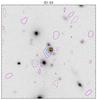
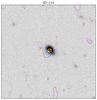
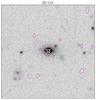
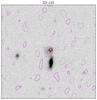
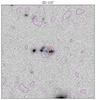
Fig. 13
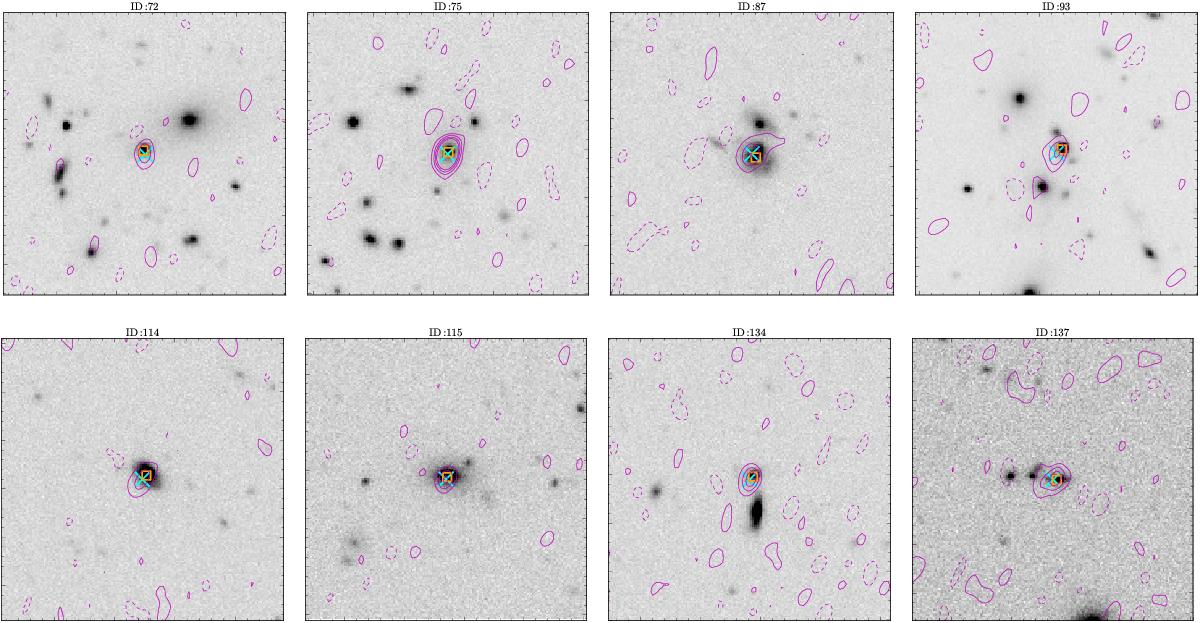
Optical images (greyscale; 35″ on the side) of potential supercluster member galaxies also detected at 3 GHz within the VLA-XXL data, overlaid with magenta radio contours. The contours start at 2σ (1σ = 10.8 μJy) and increase in steps of 2σ for all sources except source 75 where they increase in steps of 4σ. Dashed negative contours are shown at the same levels as the positive. Cyan crosses show the position of the of the VLA radio sources, orange squares represent the position of the optical counterpart. The VLA-XXL-N source IDs are shown above each panel. North is up, east is left.
Current usage metrics show cumulative count of Article Views (full-text article views including HTML views, PDF and ePub downloads, according to the available data) and Abstracts Views on Vision4Press platform.
Data correspond to usage on the plateform after 2015. The current usage metrics is available 48-96 hours after online publication and is updated daily on week days.
Initial download of the metrics may take a while.