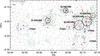
Fig. 11

Voronoi tessellation analysis of the western (top) and eastern (bottom) region of the supercluster at 0.35 <z< 0.50 (grey lines). Potential cluster galaxy members, identified via our VTA analysis (see text for details), are separated into red (g − r ≥ 1.17) and blue (g − r< 1.17) galaxies. These are shown by red filled circles and blue filled squares, respectively. The levels of the X-ray contours are shown in green at 5.28, 7.02, 12.54 and 30 cts s-1 deg -2 in the [0.5−2.5] keV range. A scale of 1 Mpc is indicated in the top left corner. The X-ray identified clusters are marked with thick black circles, and VTA identified overdense structures are marked with thin grey circles, and are labelled in the plot. Galaxies within these regions were sampled to statistically estimate the properties of clusters and overdense structures (see text and Table 3 for details).
Current usage metrics show cumulative count of Article Views (full-text article views including HTML views, PDF and ePub downloads, according to the available data) and Abstracts Views on Vision4Press platform.
Data correspond to usage on the plateform after 2015. The current usage metrics is available 48-96 hours after online publication and is updated daily on week days.
Initial download of the metrics may take a while.