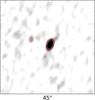
Fig. 1
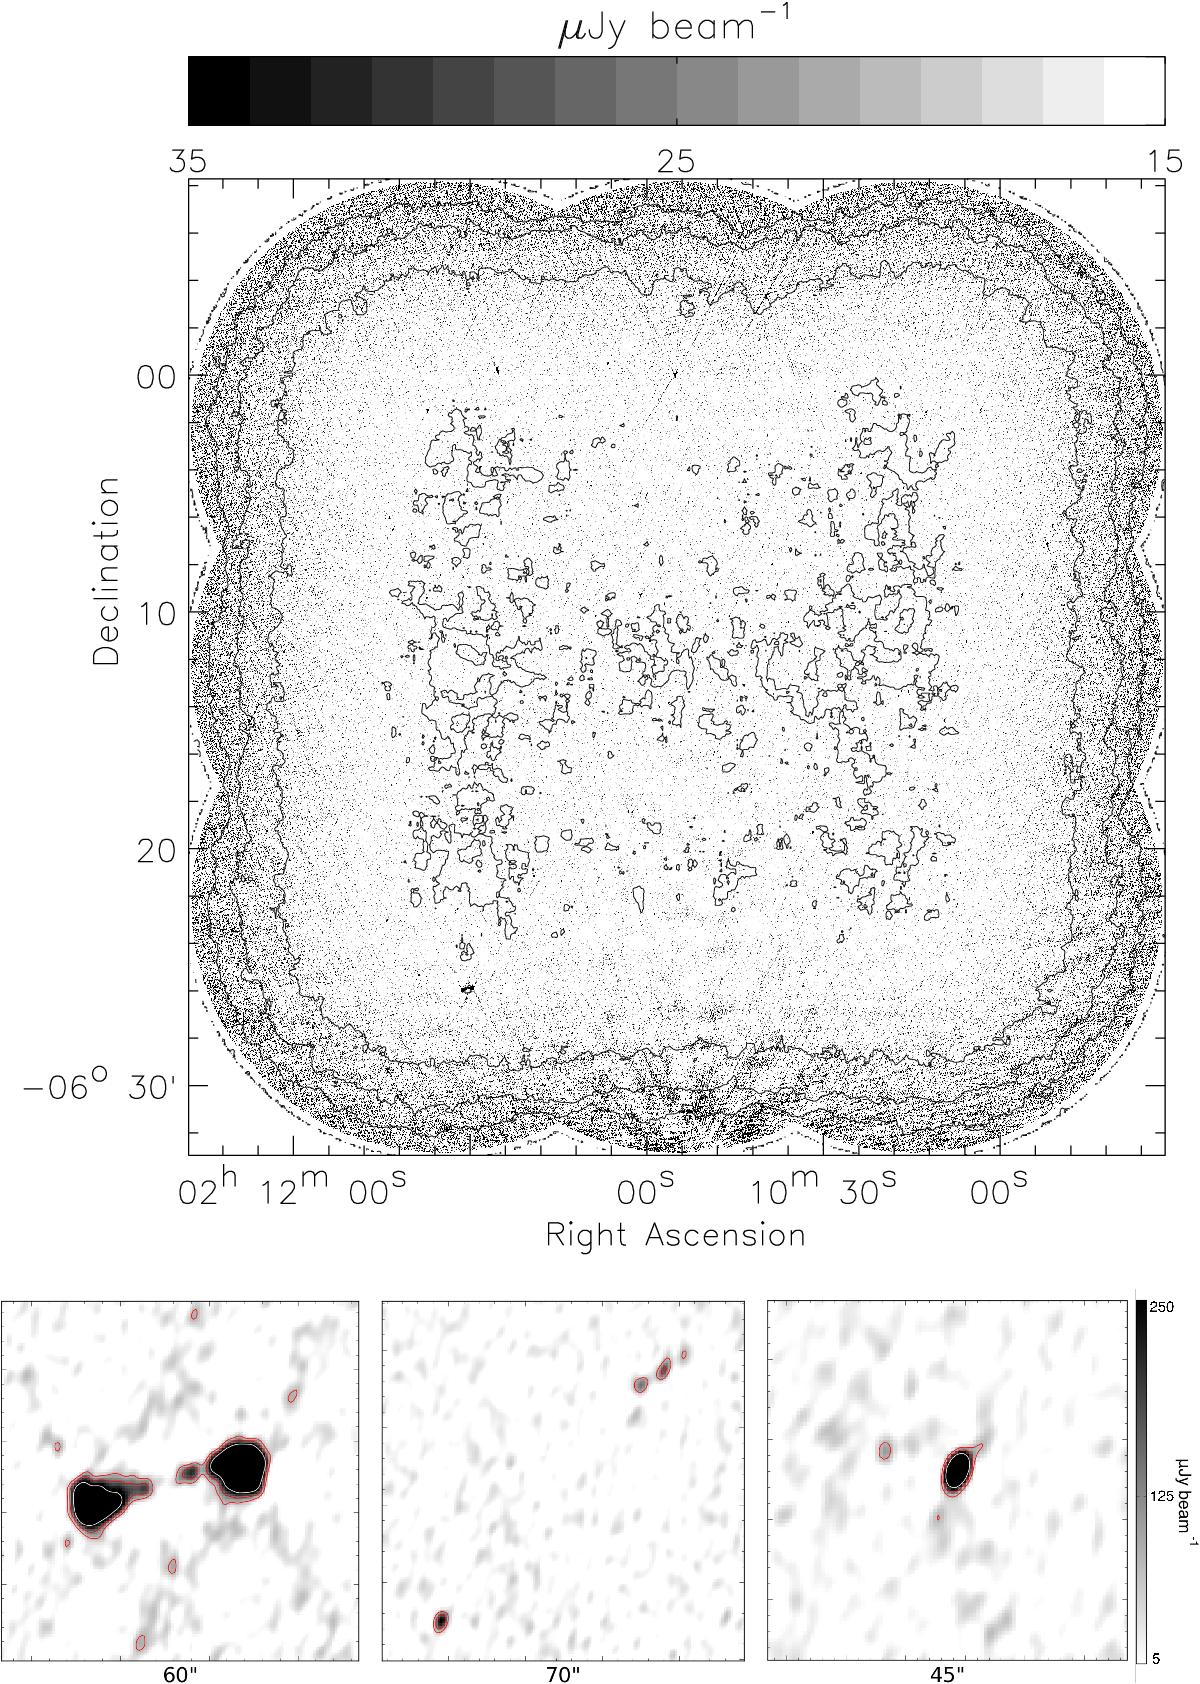
Top: greyscale mosaic of the area of XXL-N field observed with the VLA at 3 GHz with rms contours overlaid (contour levels are 10, 20, 30 and 40 μJy beam-1). Bottom: three examples of single- and multicomponent sources represented as greyscale maps with contours overlaid. The contour levels are 2iσ (i = 2,3, and 4, 1σ = 11μJy beam-1).
Current usage metrics show cumulative count of Article Views (full-text article views including HTML views, PDF and ePub downloads, according to the available data) and Abstracts Views on Vision4Press platform.
Data correspond to usage on the plateform after 2015. The current usage metrics is available 48-96 hours after online publication and is updated daily on week days.
Initial download of the metrics may take a while.