Fig. 5
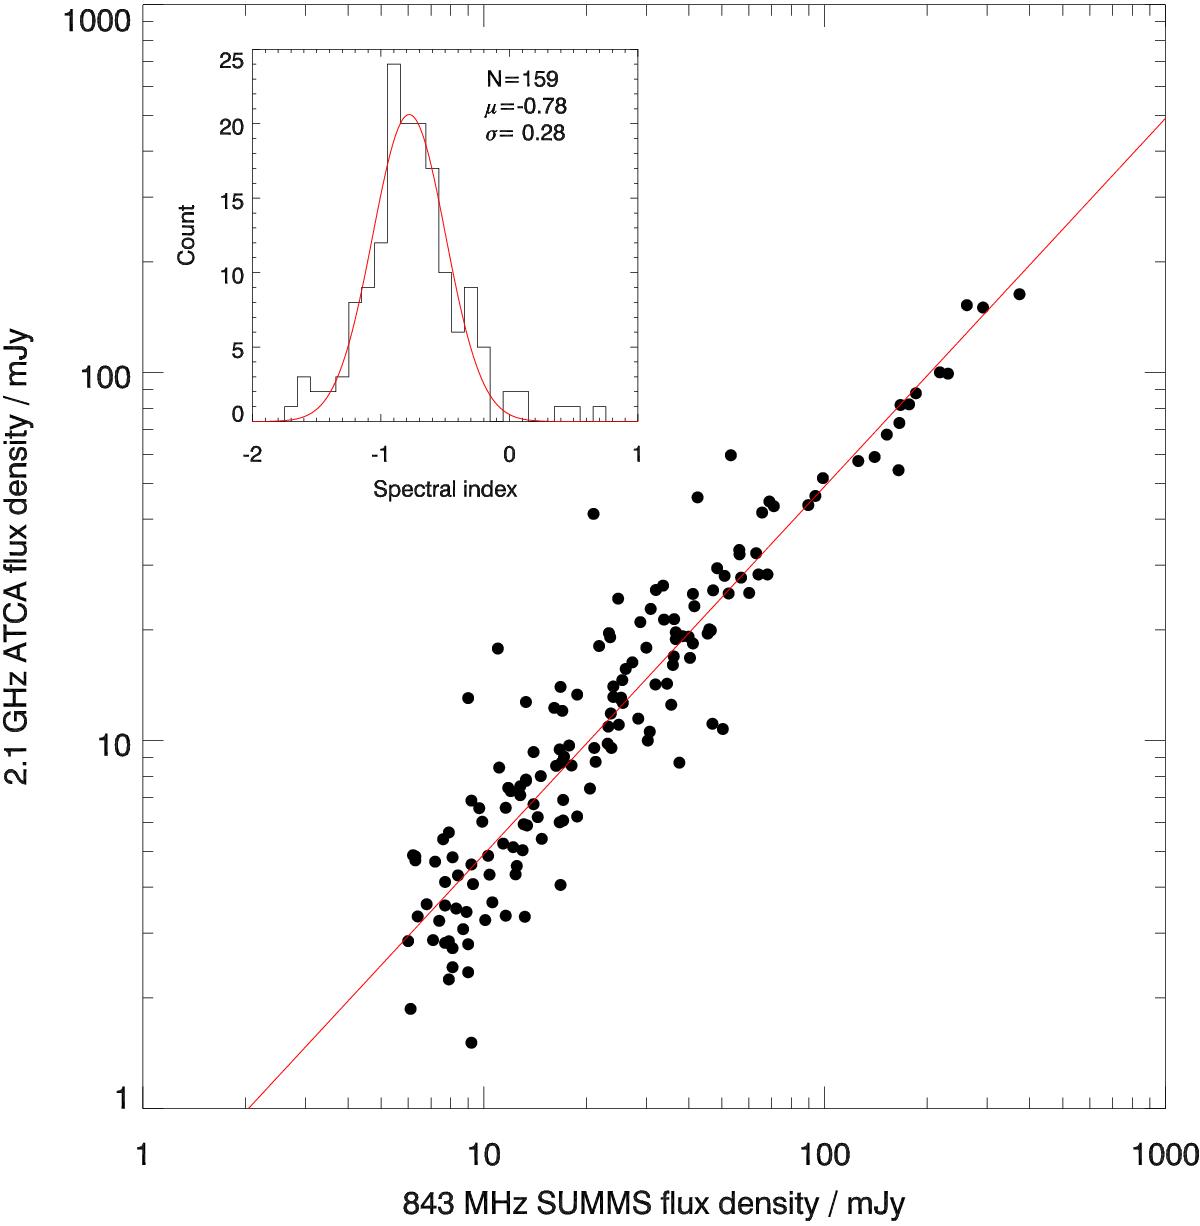
Comparison between SUMSS 843 MHz and ATCA-XXL 2.1 GHz fluxes for the XXL-S Pilot area based on 159 sources detected in the shallower (rms ~1.25 mJy/beam) SUMSS survey. The inset shows the spectral index distribution for the sources with a mean of − 0.78 and a standard deviation of 0.28. The solid line corresponds to a spectral index of − 0.78.
Current usage metrics show cumulative count of Article Views (full-text article views including HTML views, PDF and ePub downloads, according to the available data) and Abstracts Views on Vision4Press platform.
Data correspond to usage on the plateform after 2015. The current usage metrics is available 48-96 hours after online publication and is updated daily on week days.
Initial download of the metrics may take a while.