Fig. 1
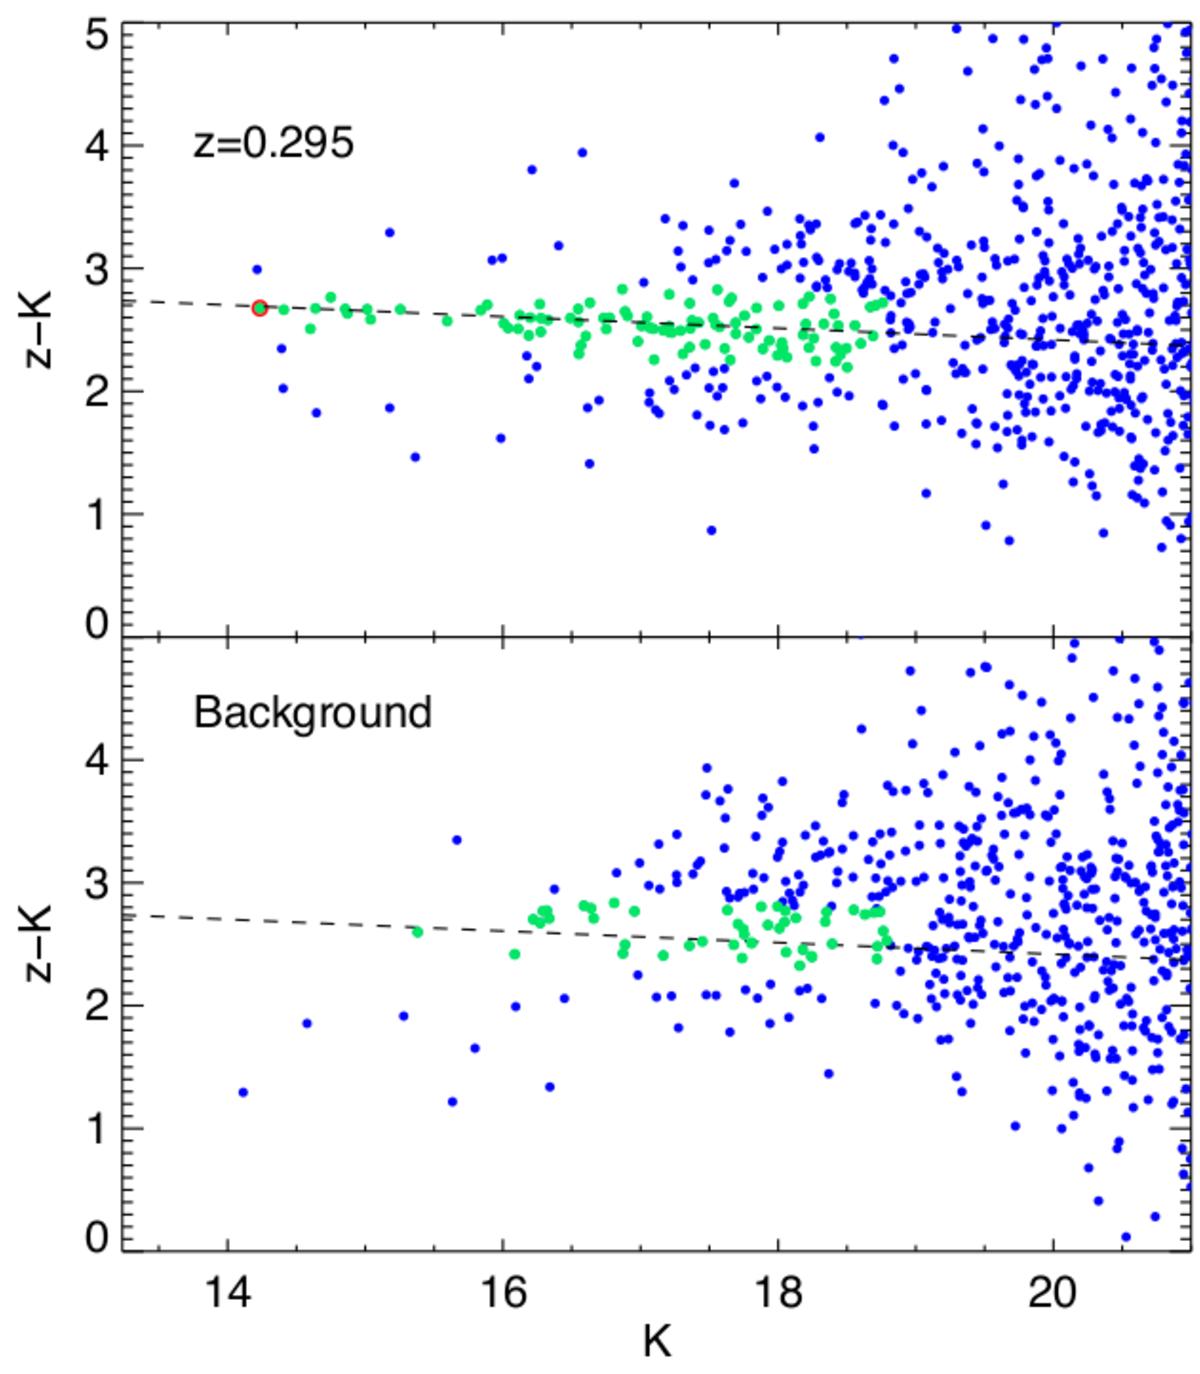
Colour–magnitude diagram for all galaxies lying in the projected distance of r500,WL for XLSSC 27 (at z = 0.295) in the XXL sample (top panel) and an area selected as background within the same projected distance (bottom panel). The dashed line shows the best linear fit for the candidate cluster members, also shown in the bottom panel for reference. The galaxies selected to account for the total K-band luminosity of the cluster and the field are shown in green (KBCG ≤ K<K∗ + 3 and ± 0.3 mag from the dashed line), while the BCG is highlighted in red. The colour sequence for the clusters appears more populated (in particular at bright magnitudes) than the background region (field) as expected.
Current usage metrics show cumulative count of Article Views (full-text article views including HTML views, PDF and ePub downloads, according to the available data) and Abstracts Views on Vision4Press platform.
Data correspond to usage on the plateform after 2015. The current usage metrics is available 48-96 hours after online publication and is updated daily on week days.
Initial download of the metrics may take a while.