Fig. 9
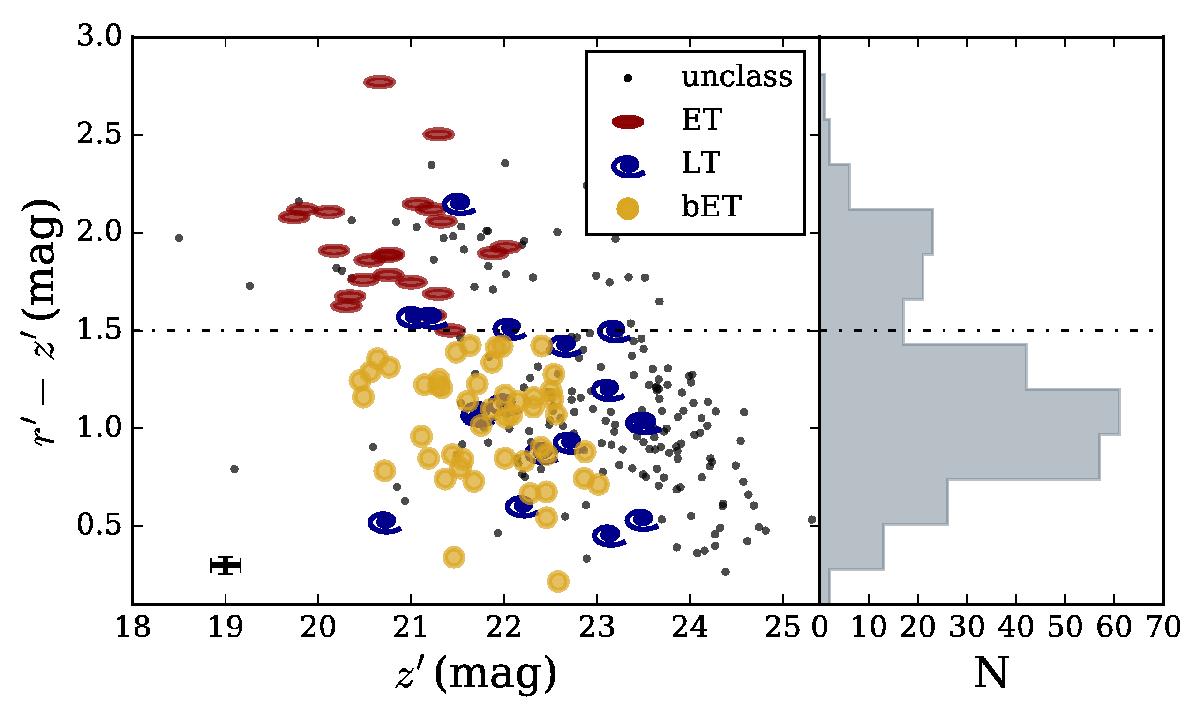
CMD of RXJ 1257 (left) and r′−z′ colour distribution (right). Symbols are the same as in Fig. 7. Blue spirals represent galaxies classified as LT, red ellipses as ET, and yellow circles are so-called blue ET galaxies. The horizontal dot-dashed line at r′−z′ = 1.5 mag is used to separate between the red and blue populations (and, consequently, to differentiate between so-called standard and blue ET galaxies). Small black dots are morphologically unclassified cluster members. The typical error bar is shown in the lower left corner of the plot. In the left panel, the histogram shows the whole cluster sample.
Current usage metrics show cumulative count of Article Views (full-text article views including HTML views, PDF and ePub downloads, according to the available data) and Abstracts Views on Vision4Press platform.
Data correspond to usage on the plateform after 2015. The current usage metrics is available 48-96 hours after online publication and is updated daily on week days.
Initial download of the metrics may take a while.