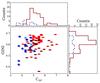
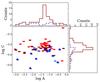
Fig. 7
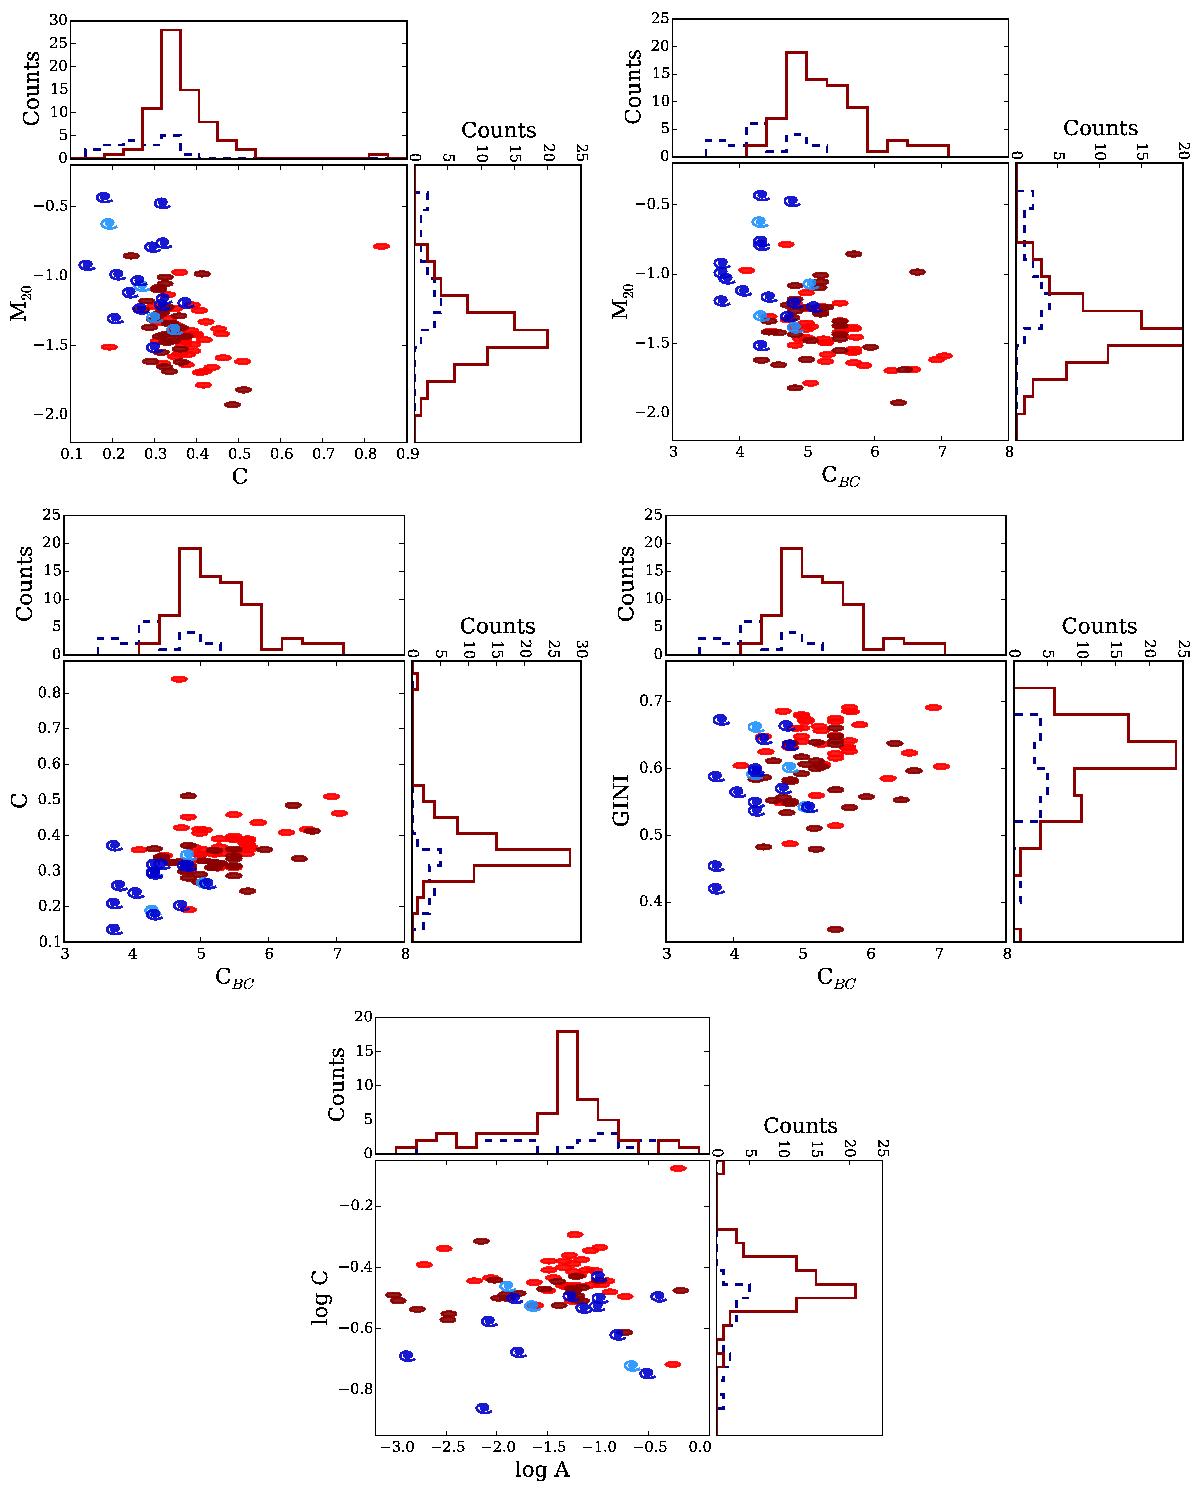
Morphological diagnostic diagrams representing the following relations: M20 (moment of light) vs. C (Abraham concentration index) (top left), M20 vs. CBC (Bershady-Conselice concentration index) (top right), C vs. CBC (centre left), GINI (Gini coefficient) vs. CBC (centre right), and log C vs. log A (asymmetry) (bottom). Blue spirals represent galaxies classified as LT, and red ellipses as ET, while light and dark colours refer to galaxies fainter and brighter than 23 mag in r′, respectively. Typical errors of all these parameters are comparable to or lower than the symbols’ size. Histograms show the morphological parameter distribution for each type, the red solid line is for ET galaxies and the blue dashed one for LT galaxies.
Current usage metrics show cumulative count of Article Views (full-text article views including HTML views, PDF and ePub downloads, according to the available data) and Abstracts Views on Vision4Press platform.
Data correspond to usage on the plateform after 2015. The current usage metrics is available 48-96 hours after online publication and is updated daily on week days.
Initial download of the metrics may take a while.