Free Access
Fig. 6
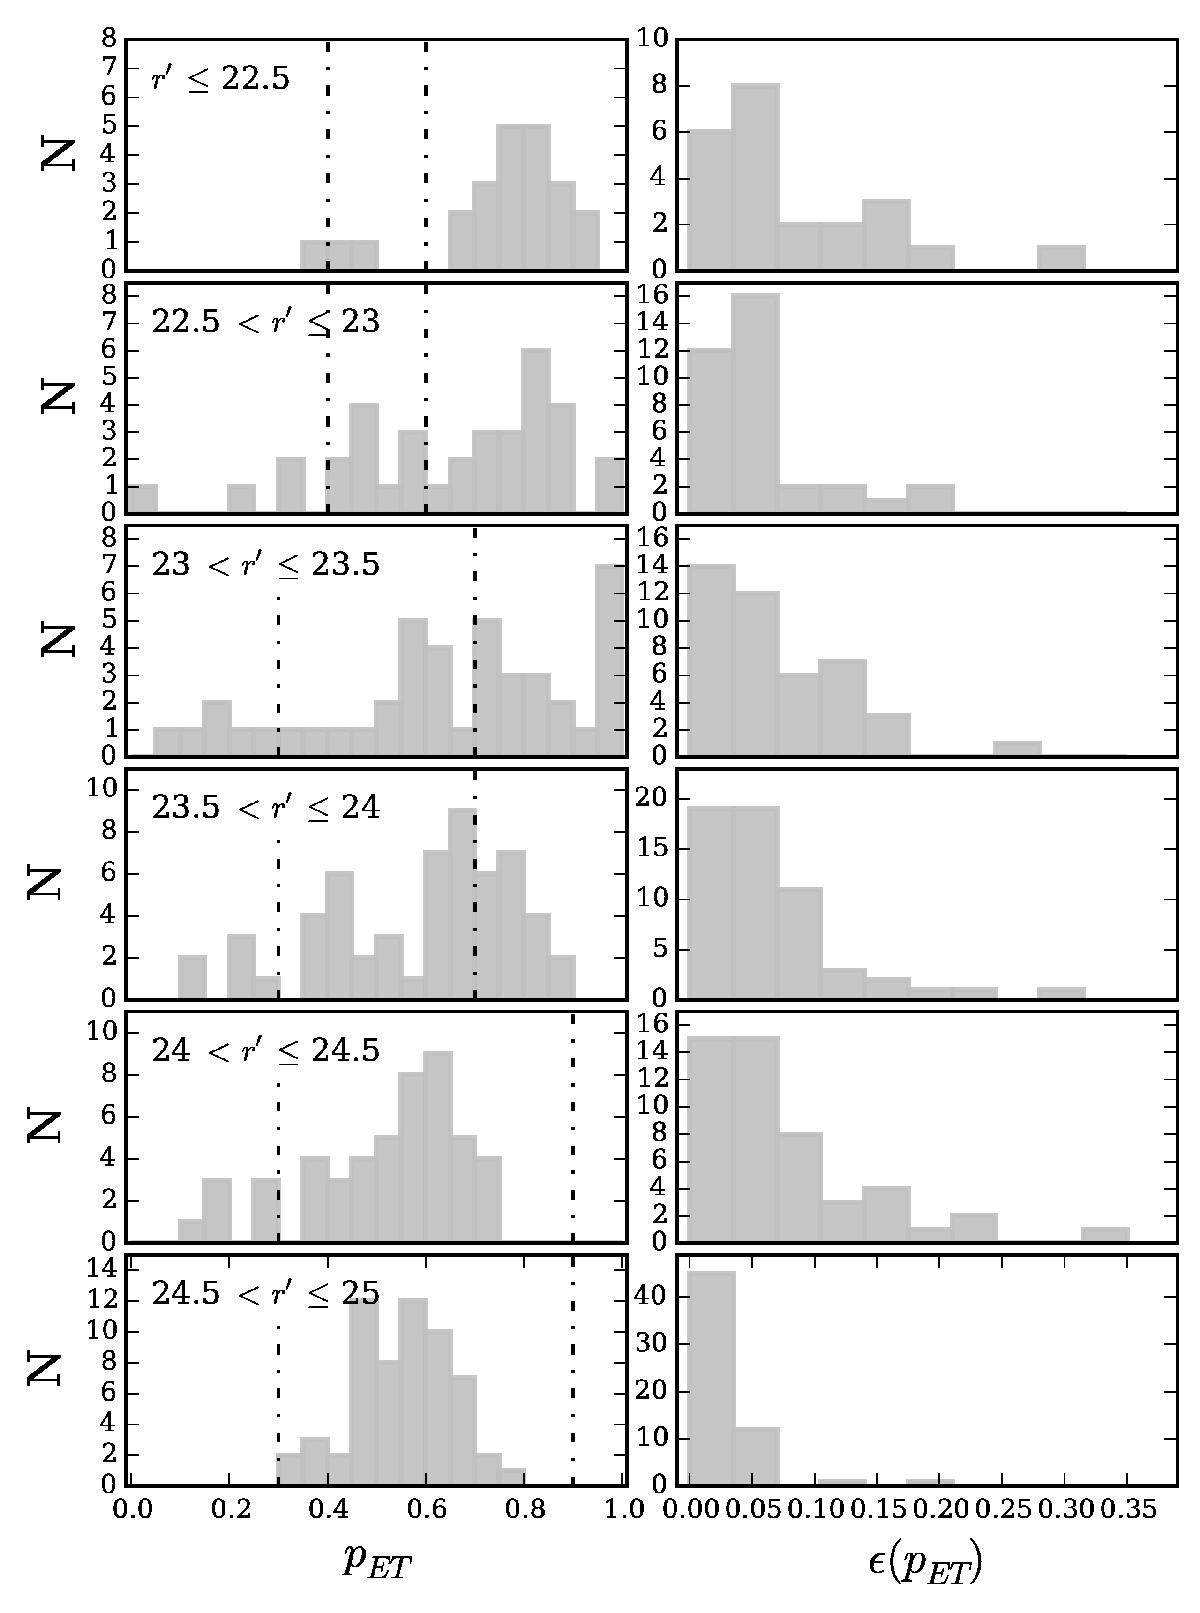
Distribution of the pET (left) and of their errors (right) for each analysed bin of magnitude. The dot-dashed vertical lines indicate the final probability boundaries we considered for the separation between morphological types, ET, and LT galaxies, as indicated in Table 1.
Current usage metrics show cumulative count of Article Views (full-text article views including HTML views, PDF and ePub downloads, according to the available data) and Abstracts Views on Vision4Press platform.
Data correspond to usage on the plateform after 2015. The current usage metrics is available 48-96 hours after online publication and is updated daily on week days.
Initial download of the metrics may take a while.