Fig. 20
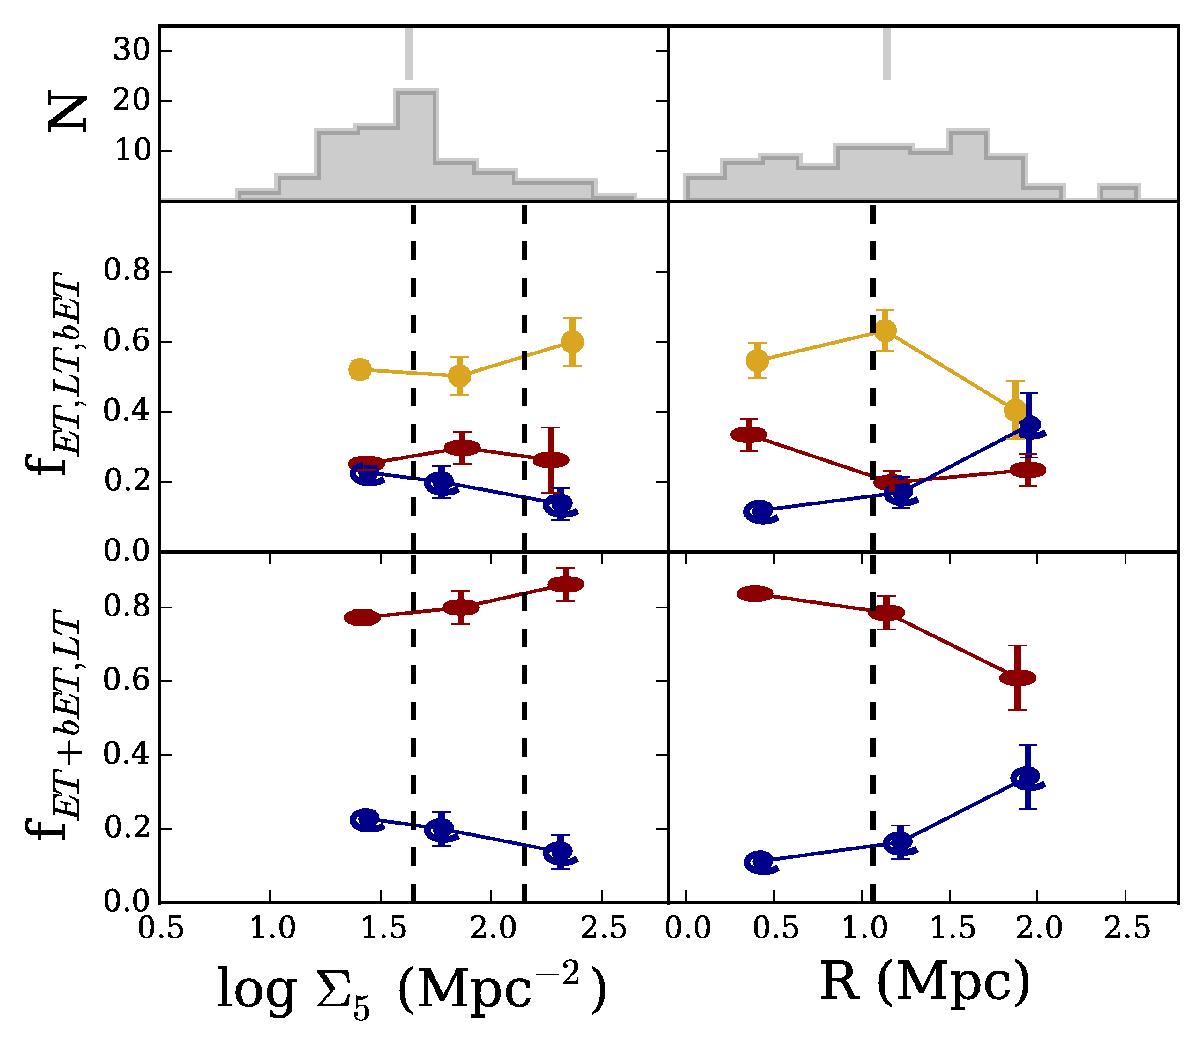
Morphological types − LT (blue spirals), ET (red ellipses), and ET galaxies with blue g′−z′ colours (yellow circles) − as a function of the local galaxy density (left) and the cluster-centric radius (right), represented as the fraction of the morphological types in three densities/radius. Top panels: represent the local density and cluster-centric distance distributions for the full classified sample. The vertical lines indicates the mean value of each distribution. The dashed vertical lines are the original local density limit between environments defined by KO08 (left) and the virial radius estimated by Ulmer et al. (2009; right). Error bars are estimated as the standard deviation of the fraction distribution built by bootstrap.
Current usage metrics show cumulative count of Article Views (full-text article views including HTML views, PDF and ePub downloads, according to the available data) and Abstracts Views on Vision4Press platform.
Data correspond to usage on the plateform after 2015. The current usage metrics is available 48-96 hours after online publication and is updated daily on week days.
Initial download of the metrics may take a while.