Fig. 17
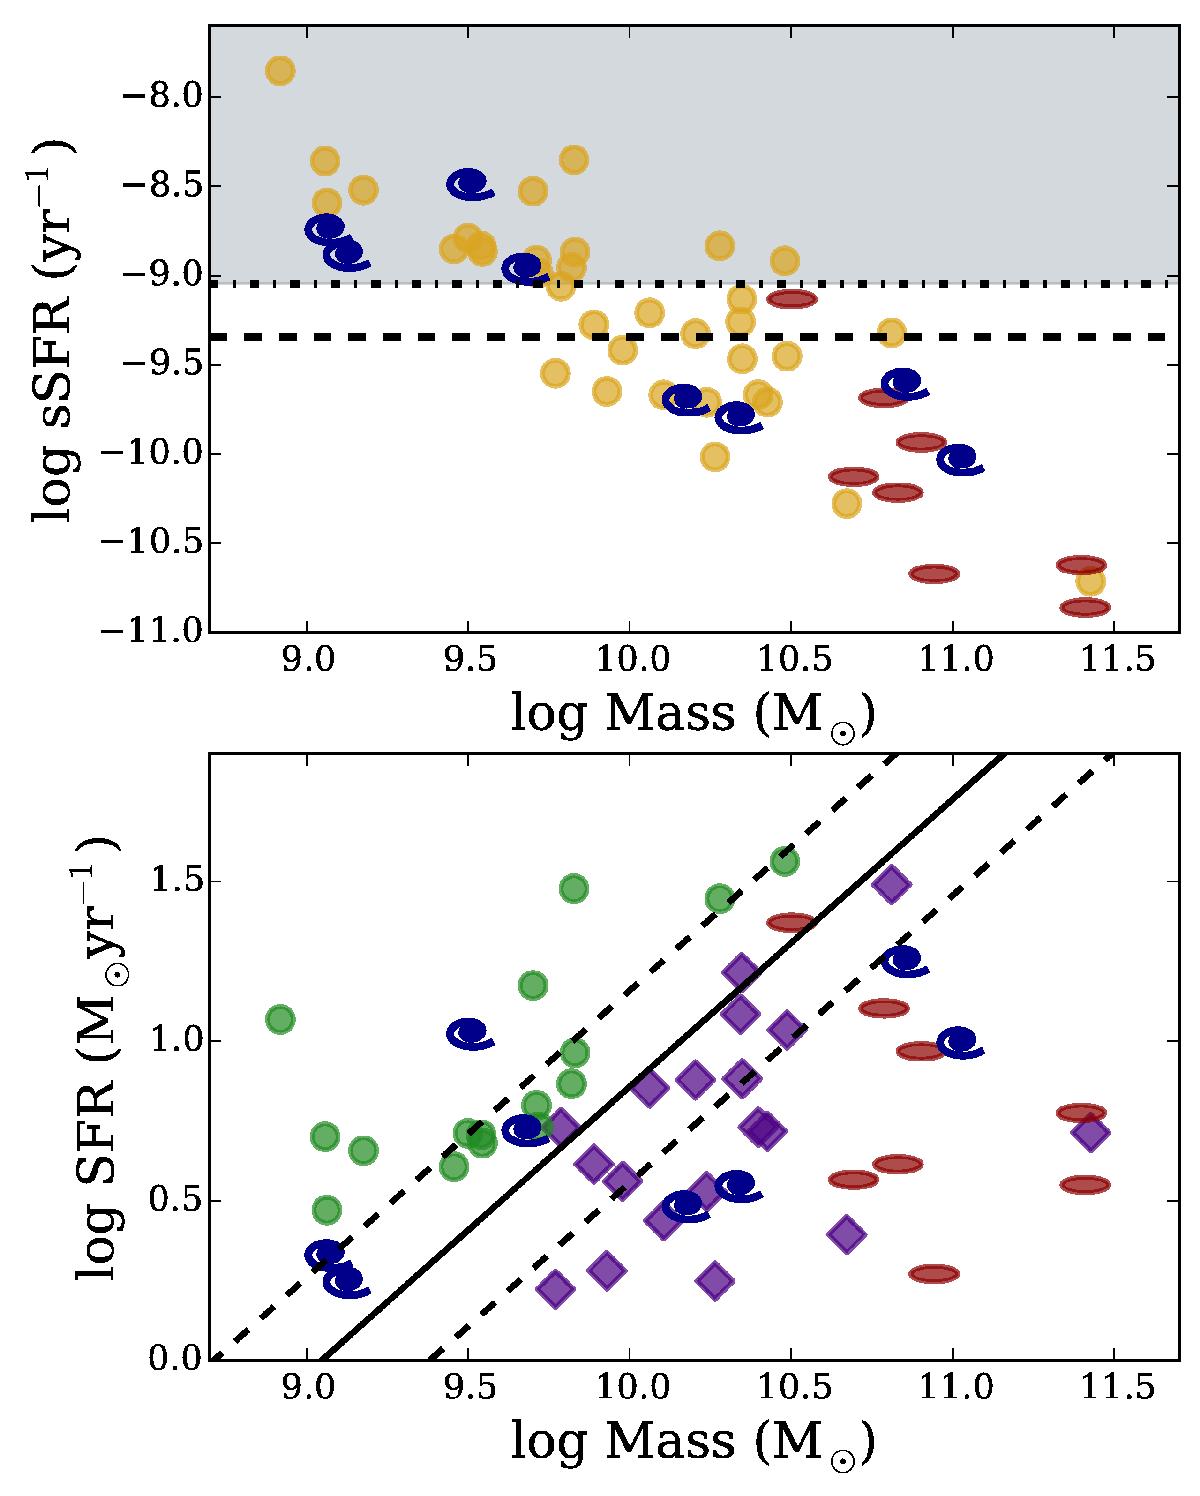
sSFR (top) and SFR (bottom), estimated both with the FIR and [O ii] emission, as a function of the stellar mass. As in previous figures, dark blue spirals are LT and red elongated ellipses are ET galaxies. In the top panel, yellow circles are blue ETs (those galaxies that by their probability are classified as ET but their g′−z′ colour is below the 2 mag limit). The horizontal dashed line corresponds to the relation of Elbaz et al. (2011) for the main-sequence galaxies at the redshift of the cluster, and the dash-dotted line indicates the lower limit for the starburst region (grey shaded area). This line is the threshold used to split the sample into LCBGs (in the starbust area) and ETs with recent star formation (in the main sequence). In the bottom panel, green circles are LCBGs and violet diamonds ET galaxies with star formation, as classified in the top panel. The solid line indicates the SFR-M⋆ correlation from Elbaz et al. (2007), and the dashed lines show the 68% dispersion.
Current usage metrics show cumulative count of Article Views (full-text article views including HTML views, PDF and ePub downloads, according to the available data) and Abstracts Views on Vision4Press platform.
Data correspond to usage on the plateform after 2015. The current usage metrics is available 48-96 hours after online publication and is updated daily on week days.
Initial download of the metrics may take a while.