Fig. 13
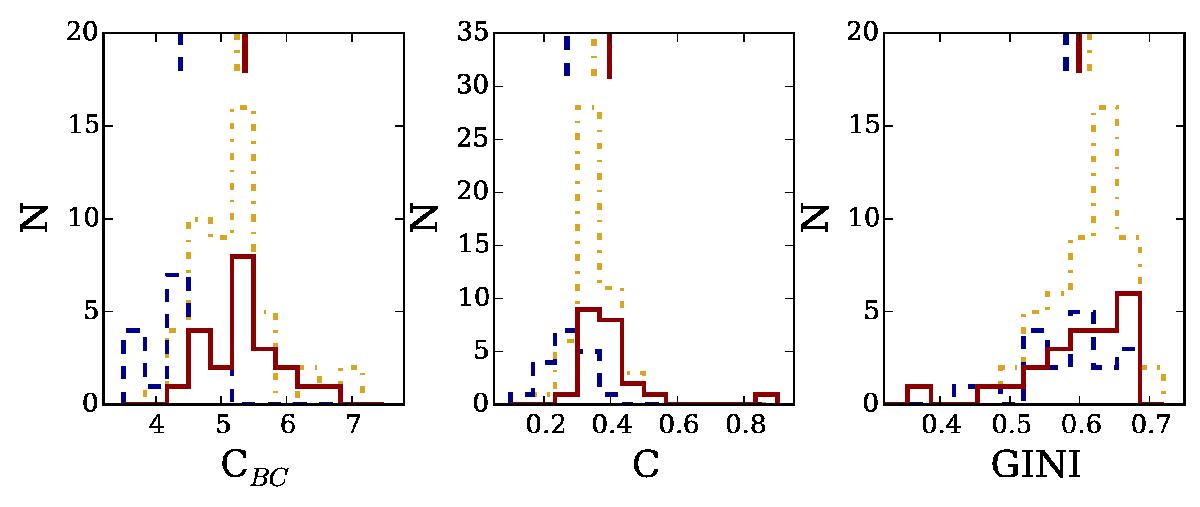
Distributions of the morphological concentration parameters (C, CBC, GINI) for the three morphological samples. The LT sample is represented by the dark blue dashed line, the ET sample by the red solid line, and the blue ET sample by the yellow dash-dotted line. Top vertical lines indicate the mean values of each distribution.
Current usage metrics show cumulative count of Article Views (full-text article views including HTML views, PDF and ePub downloads, according to the available data) and Abstracts Views on Vision4Press platform.
Data correspond to usage on the plateform after 2015. The current usage metrics is available 48-96 hours after online publication and is updated daily on week days.
Initial download of the metrics may take a while.