Fig. 9
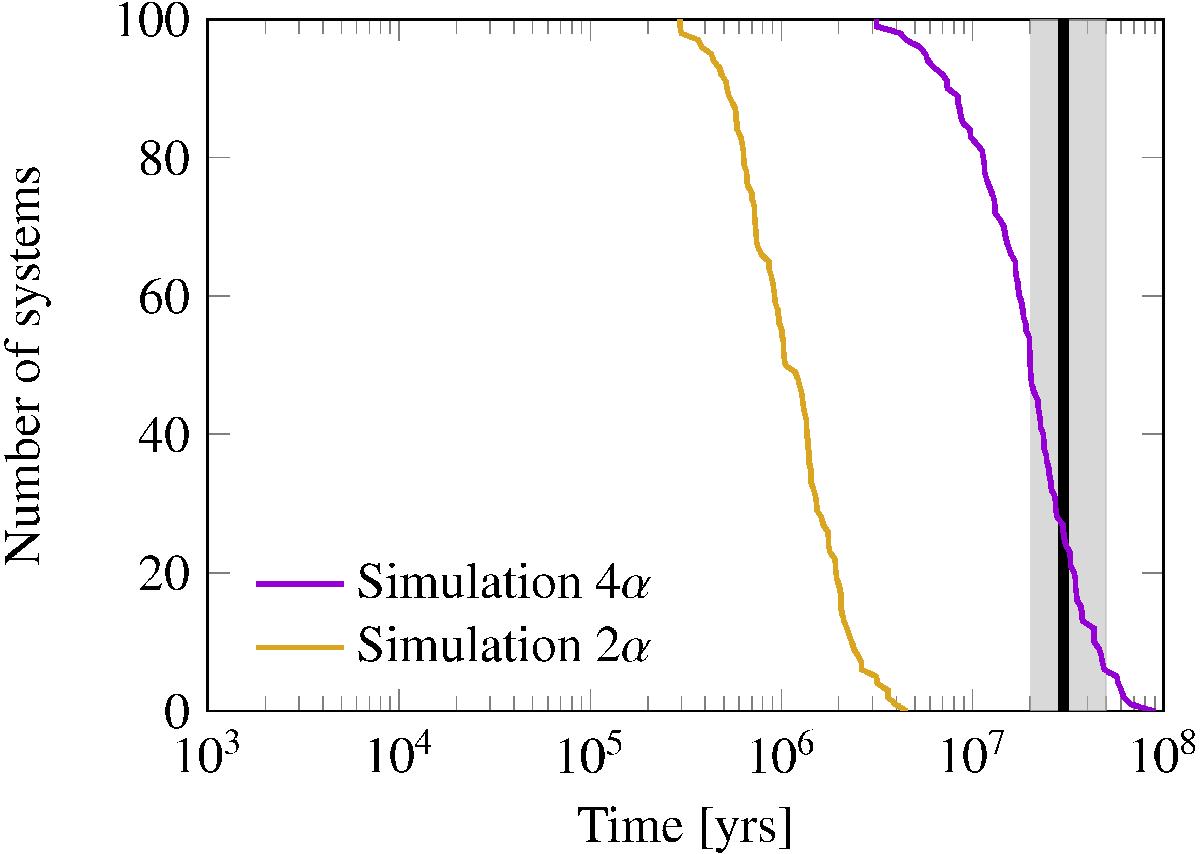
Comparison between simulations 4α (violet) and 2α (yellow). The lines show the number of systems in the simulation that have not experienced a close encounter, plotted with time. The slightly wider orbits in simulation 4α compared to simulation 2α makes the systems close encounter time shift about an order of magnitude. The black line and the grey zone show the age estimate and uncertainty of HR 8799.
Current usage metrics show cumulative count of Article Views (full-text article views including HTML views, PDF and ePub downloads, according to the available data) and Abstracts Views on Vision4Press platform.
Data correspond to usage on the plateform after 2015. The current usage metrics is available 48-96 hours after online publication and is updated daily on week days.
Initial download of the metrics may take a while.