Fig. 8
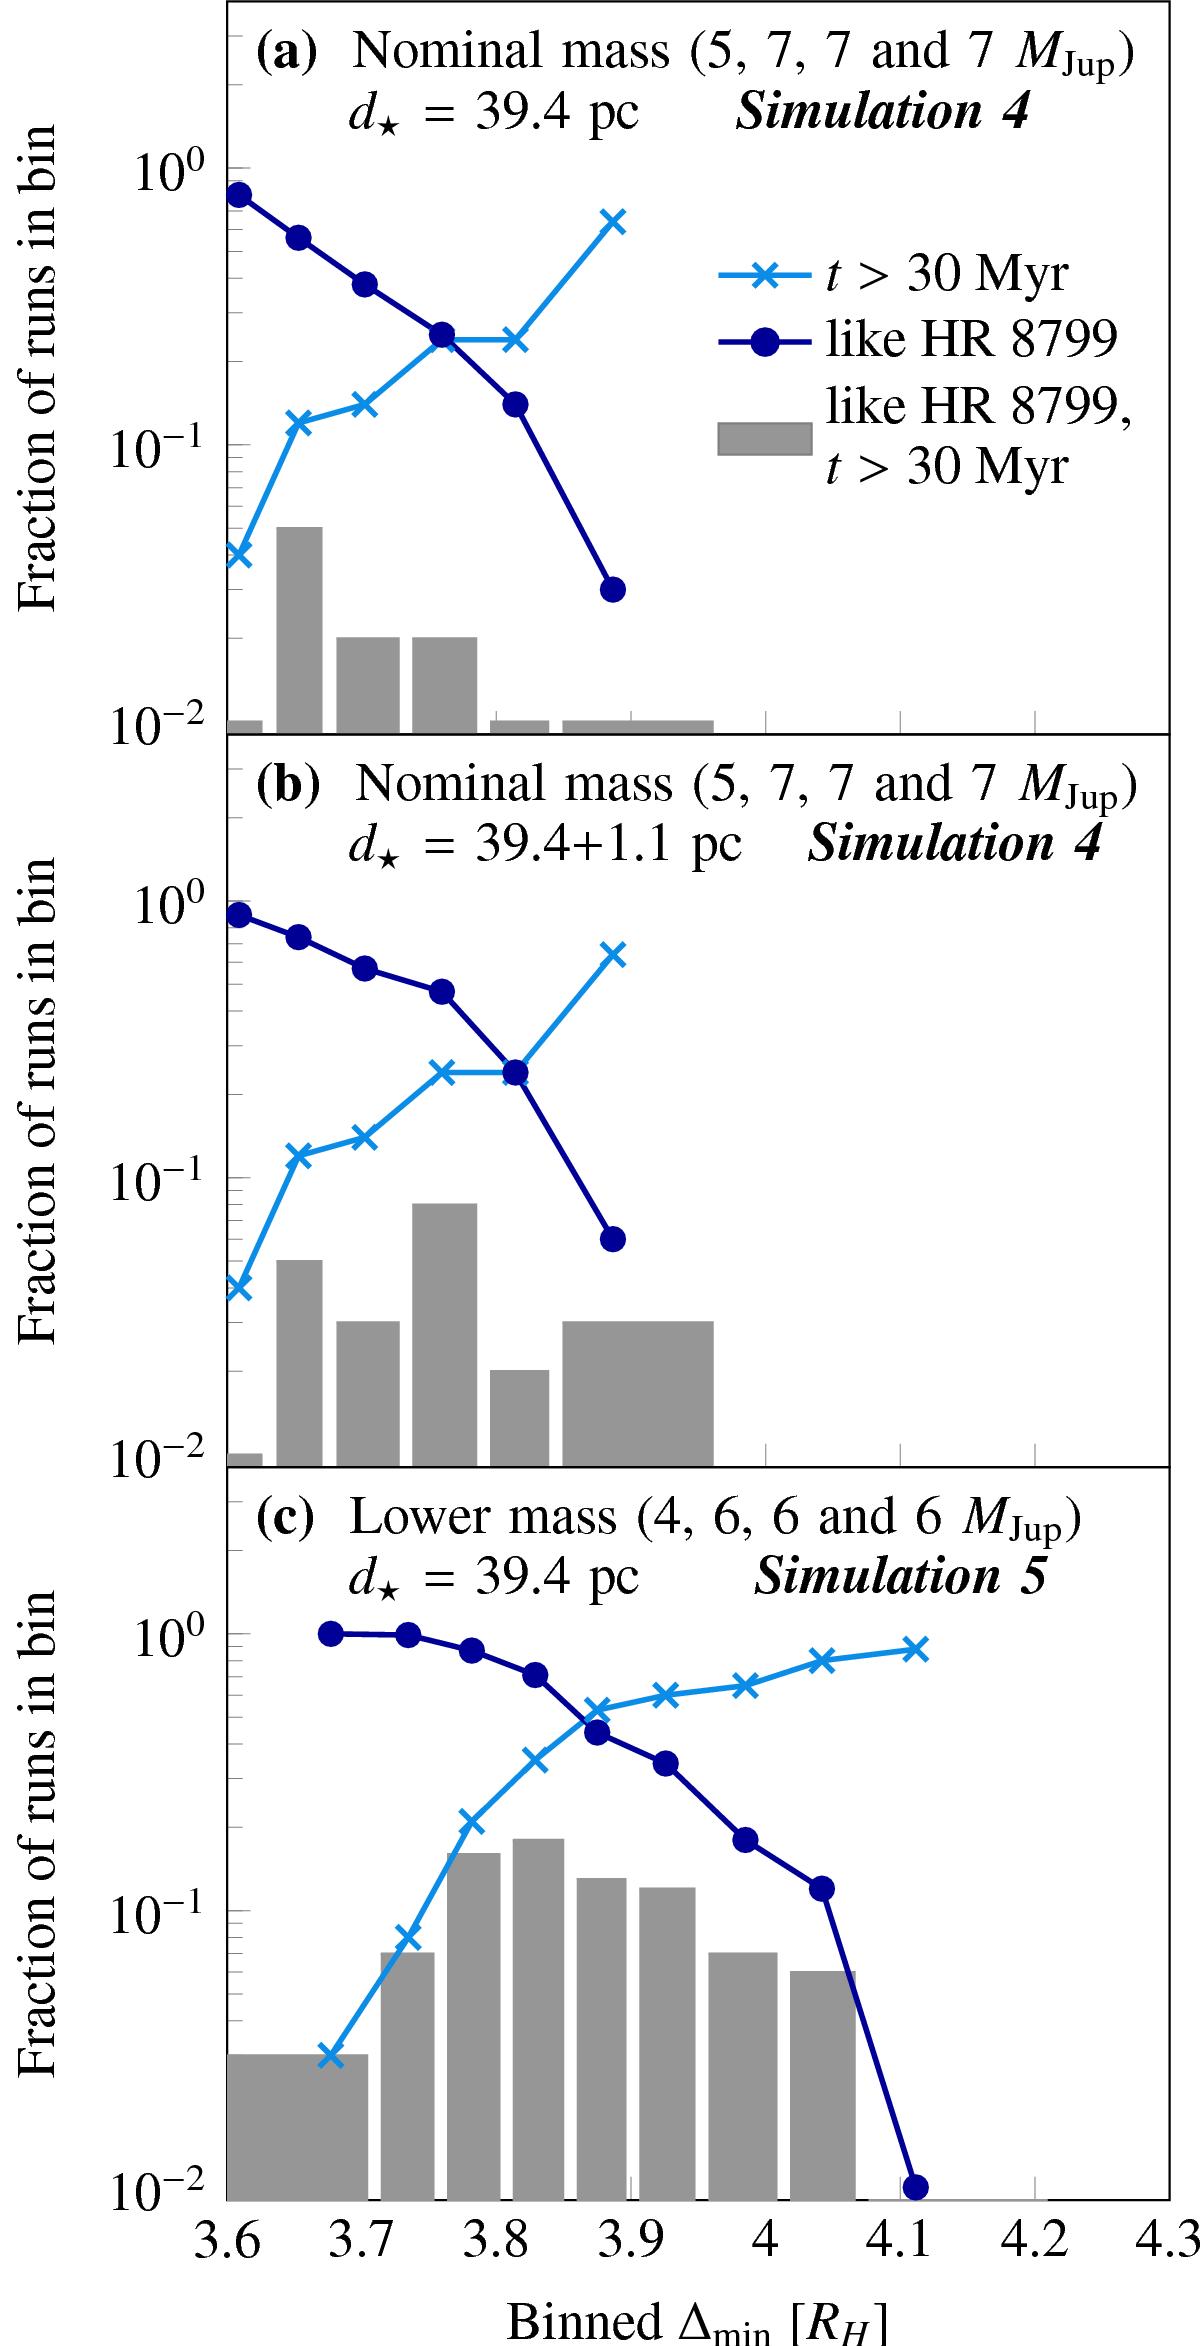
We show how many of our systems in simulation 4 (top and middle panels) and simulation 5 (bottom panel) fit the observations. We binned the simulations in ranges of minimum orbit separations, Δmin, 100 systems in each bin. The light blue shows the fraction of the systems in the bin that have a stability timescale longer than the estimated age of HR 8799. The dark blue curve shows the fraction of the systems in the bin that have architectures fitting to that of HR 8799. We determine whether a system fits through the procedure described in Sect. 4.2. The grey bars indicate the fraction of systems in each bin that fulfil both criteria. The top panel shows the results from simulation 4 using the mean of the Earth-HR 8799 distance estimate (39.4 pc), the middle panel shows the results from simulation 4 using a one standard deviation longer Earth-HR 8799 distance (40.5 pc), and the bottom panel shows the results from simulation 5, which has slightly lower planet masses, but is still within the estimated range.
Current usage metrics show cumulative count of Article Views (full-text article views including HTML views, PDF and ePub downloads, according to the available data) and Abstracts Views on Vision4Press platform.
Data correspond to usage on the plateform after 2015. The current usage metrics is available 48-96 hours after online publication and is updated daily on week days.
Initial download of the metrics may take a while.