Fig. 7
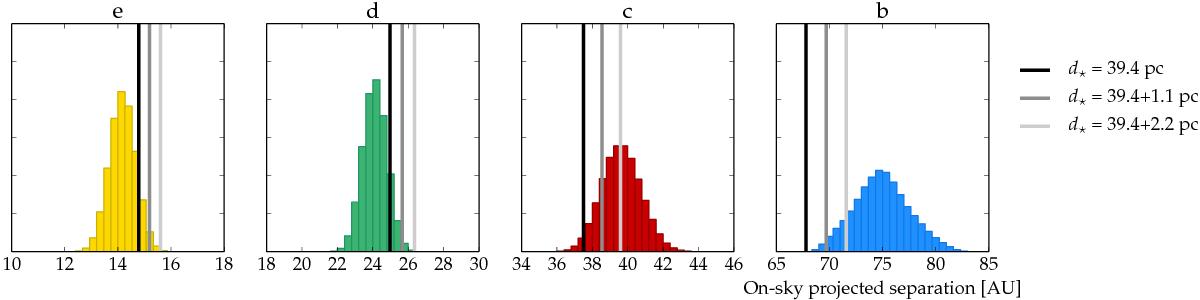
Comparison of simulations to observed planet positions for planet e, d, c, and b subsequently. The histograms show the star-planet distance in our system 94, simulation 4e, after having moved all output to the observed position angle of the planet, bootstrapped a data set, and added a normally distributed error to the simulation data. We show, in black, dark grey, and light grey lines, the observed on-sky star-planet distances from Currie et al. (2011) assuming the mean Earth-HR 8799 distance (39.4 pc) and adding 1 and 2σ of this distance estimate (van Leeuwen 2007). This procedure is described in detail in Sect. 4.2.
Current usage metrics show cumulative count of Article Views (full-text article views including HTML views, PDF and ePub downloads, according to the available data) and Abstracts Views on Vision4Press platform.
Data correspond to usage on the plateform after 2015. The current usage metrics is available 48-96 hours after online publication and is updated daily on week days.
Initial download of the metrics may take a while.