Fig. 5
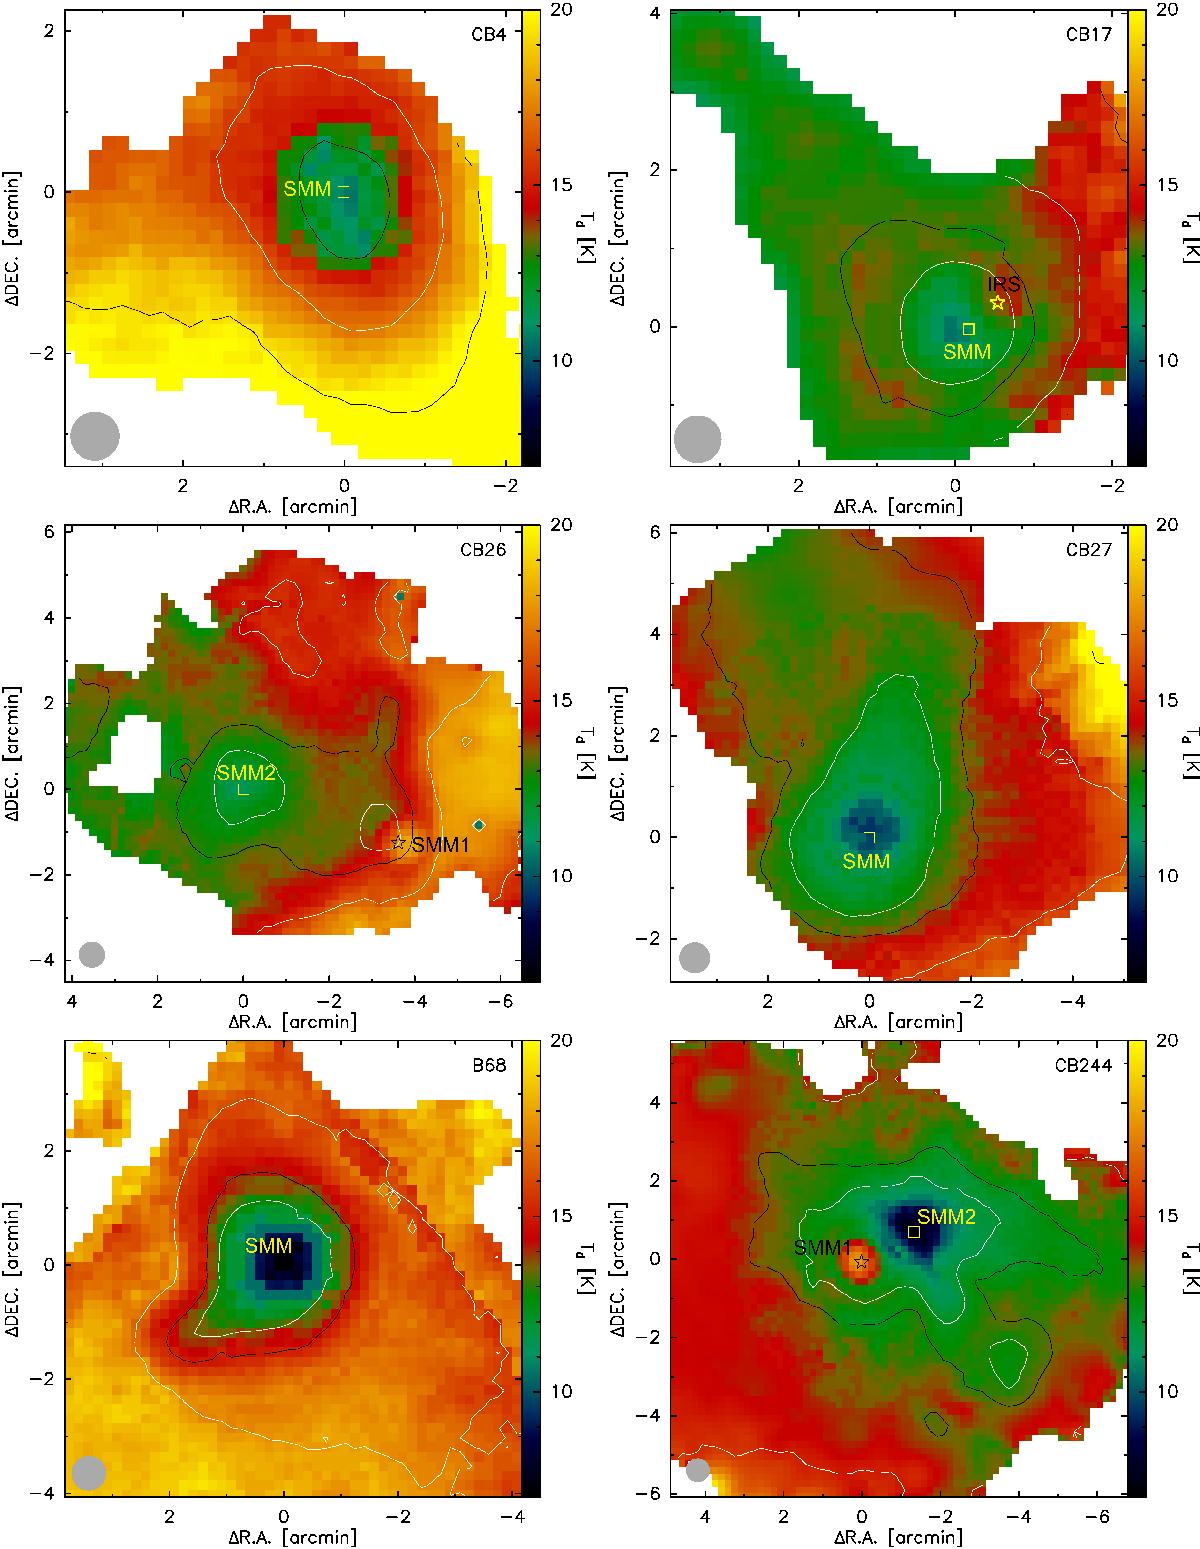
Mid-plane dust temperature maps (color, all maps on the same scale) of all six globules studied in this paper, derived with the ray-tracing inversion technique and overlaid with contours of the hydrogen column density (white: 1021 and 1022 cm-2, black: 0.5 and 5 × 1021 cm-2). Yellow squares indicate the center positions of the starless cores as listed in Table 1 and in Launhardt et al. (2013). Asterisks indicate the positions of embedded protostars (see Launhardt et al. 2013).
Current usage metrics show cumulative count of Article Views (full-text article views including HTML views, PDF and ePub downloads, according to the available data) and Abstracts Views on Vision4Press platform.
Data correspond to usage on the plateform after 2015. The current usage metrics is available 48-96 hours after online publication and is updated daily on week days.
Initial download of the metrics may take a while.