Free Access
Fig. 3
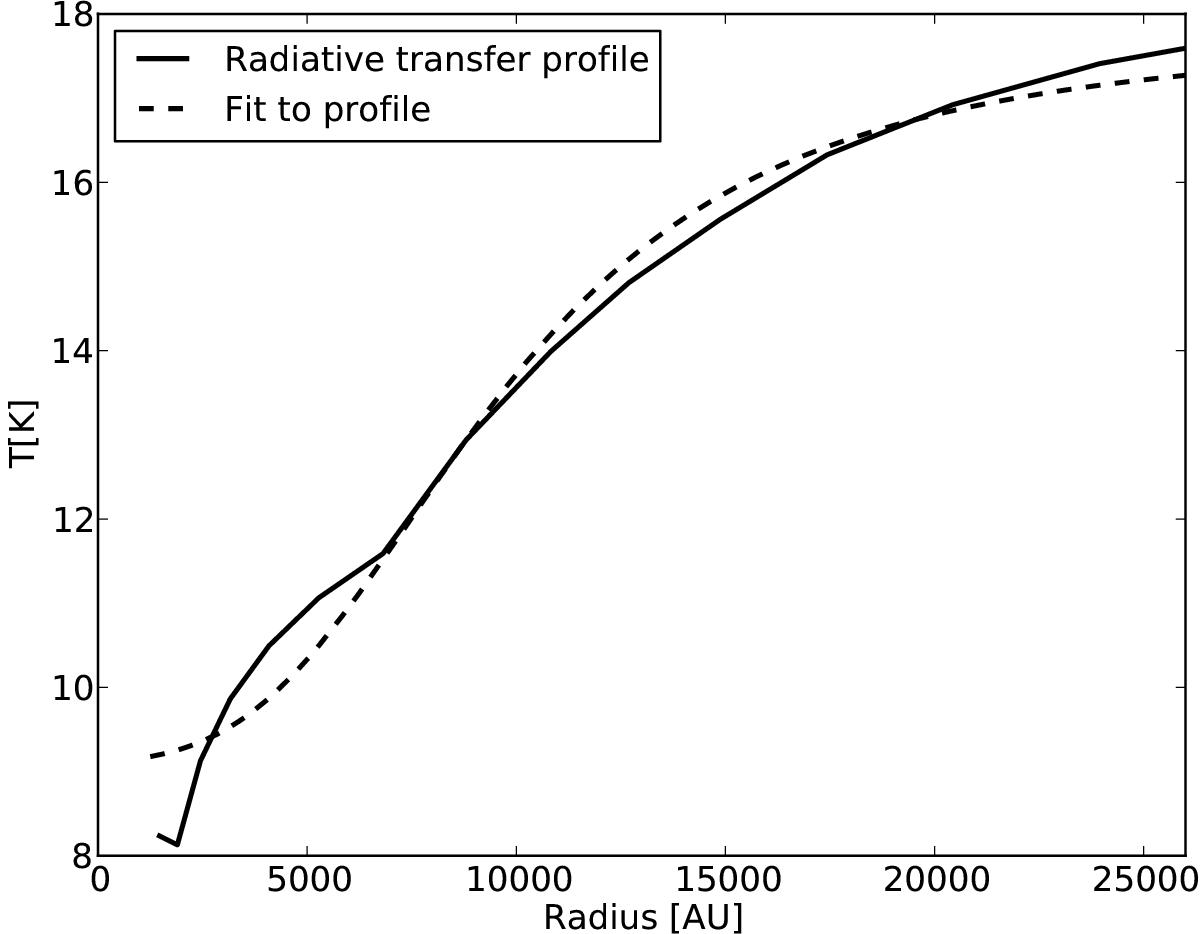
Comparison of the self-consistently calculated equilibrium temperature profile for B 68 (solid line) and an analytical profile fit following Eq. (2). The little kinks in the radiative transfer temperature curve at r ≈ 2000 and 7000 au are computational artefacts due to the high optical depth.
Current usage metrics show cumulative count of Article Views (full-text article views including HTML views, PDF and ePub downloads, according to the available data) and Abstracts Views on Vision4Press platform.
Data correspond to usage on the plateform after 2015. The current usage metrics is available 48-96 hours after online publication and is updated daily on week days.
Initial download of the metrics may take a while.