Fig. 11
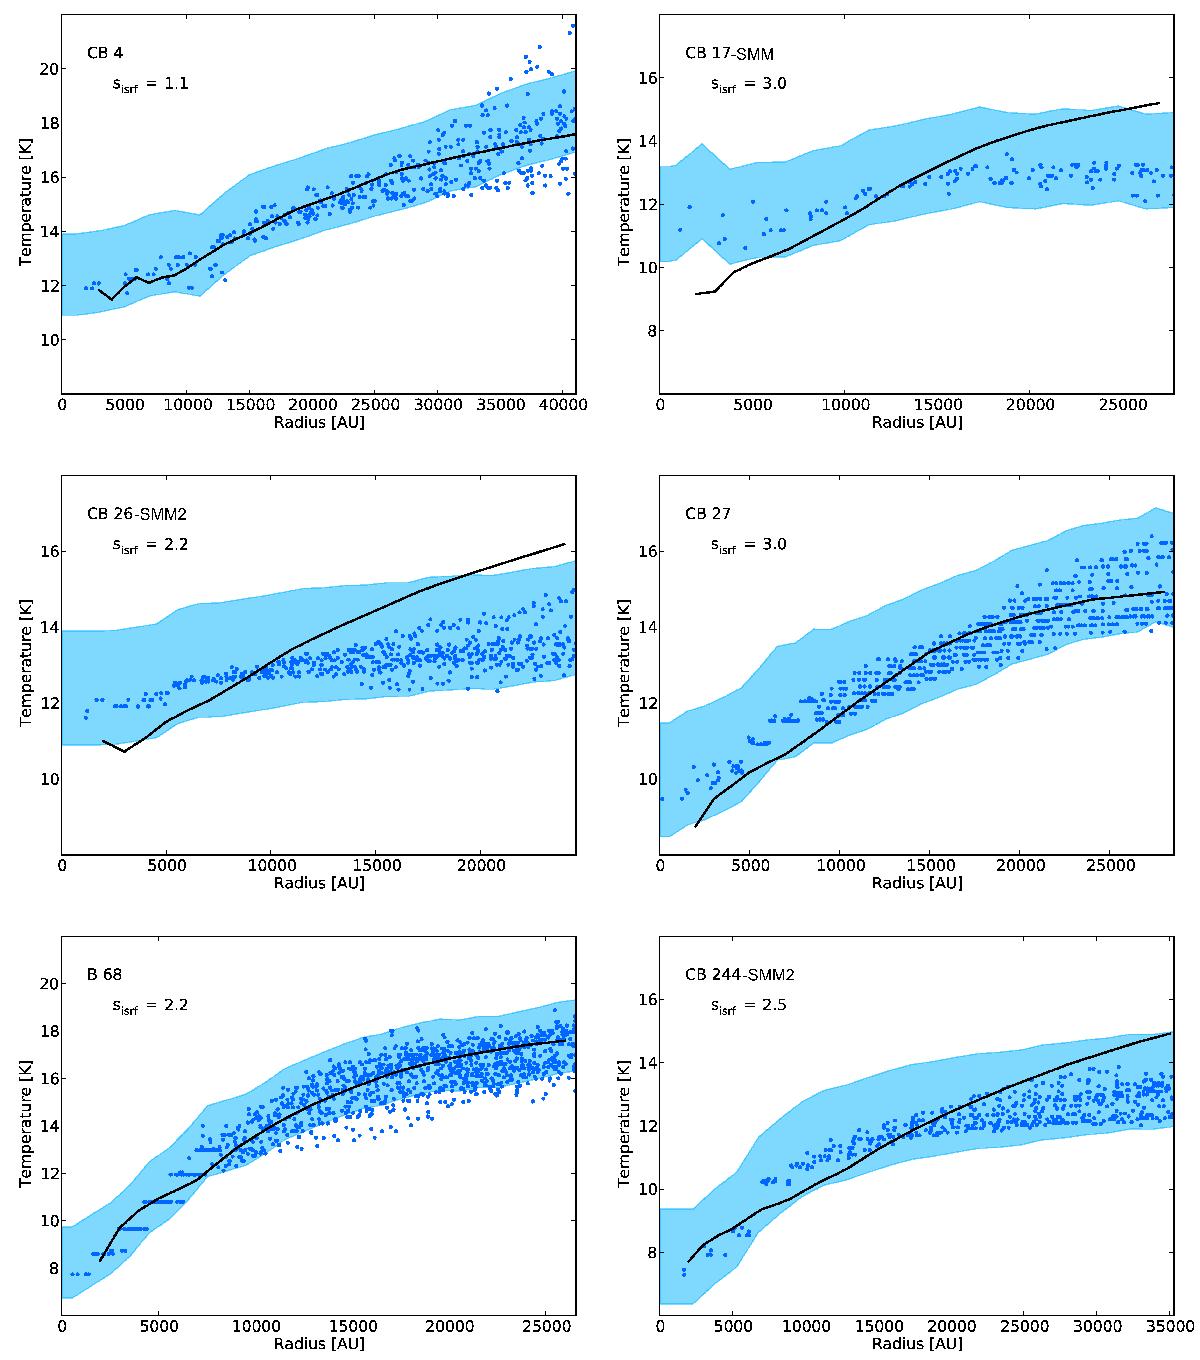
Comparison of the temperature distributions derived with the ray-tracing inversion technique (blue dots and shaded regions) to the best-matching thermal equilibrium temperature distributions (black lines). Blue dots represent pixel values of the mid-plane temperature map derived with the ray-tracing inversion method. Shaded regions indicate the uncertainty of the mean temperature profile which we estimate as ![]() K (Sect. 5.1). All models assume OH5a dust. Best-matching scaling factors sIRSF for the total flux of the ISRF are also indicated in each panel.
K (Sect. 5.1). All models assume OH5a dust. Best-matching scaling factors sIRSF for the total flux of the ISRF are also indicated in each panel.
Current usage metrics show cumulative count of Article Views (full-text article views including HTML views, PDF and ePub downloads, according to the available data) and Abstracts Views on Vision4Press platform.
Data correspond to usage on the plateform after 2015. The current usage metrics is available 48-96 hours after online publication and is updated daily on week days.
Initial download of the metrics may take a while.