Fig. 10
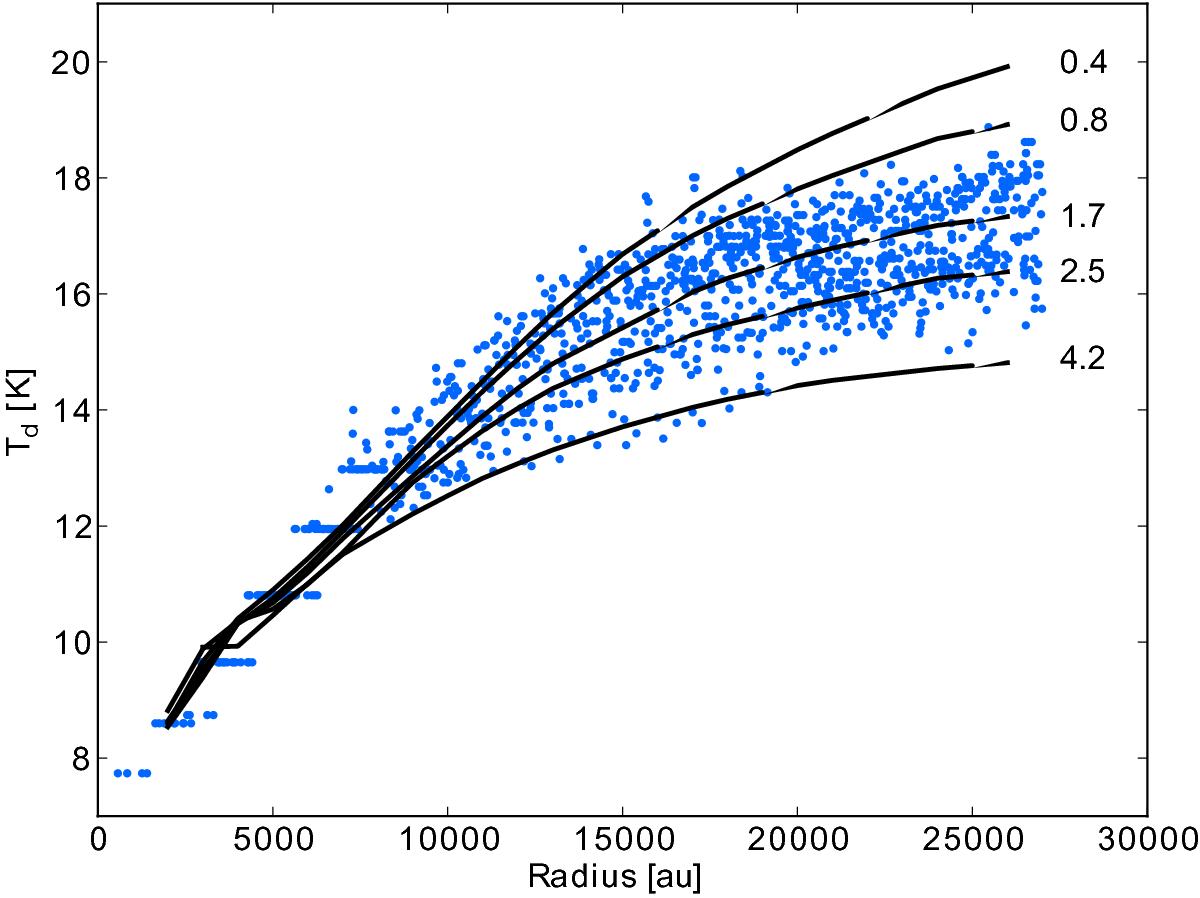
Effect on the radial equilibrium temperature distribution predicted for B 68 from varying the envelope extinction of B 68 via NH(rsym) for values of 0.4,0.8,1.7,2.5,4.2 × 1021 H cm-3 (with OH5a dust and sISRF = const. = 2.2; black lines). Blue dots show the mid-plane dust temperature distribution inferred with the ray-tracing inversion.
Current usage metrics show cumulative count of Article Views (full-text article views including HTML views, PDF and ePub downloads, according to the available data) and Abstracts Views on Vision4Press platform.
Data correspond to usage on the plateform after 2015. The current usage metrics is available 48-96 hours after online publication and is updated daily on week days.
Initial download of the metrics may take a while.