Fig. 1
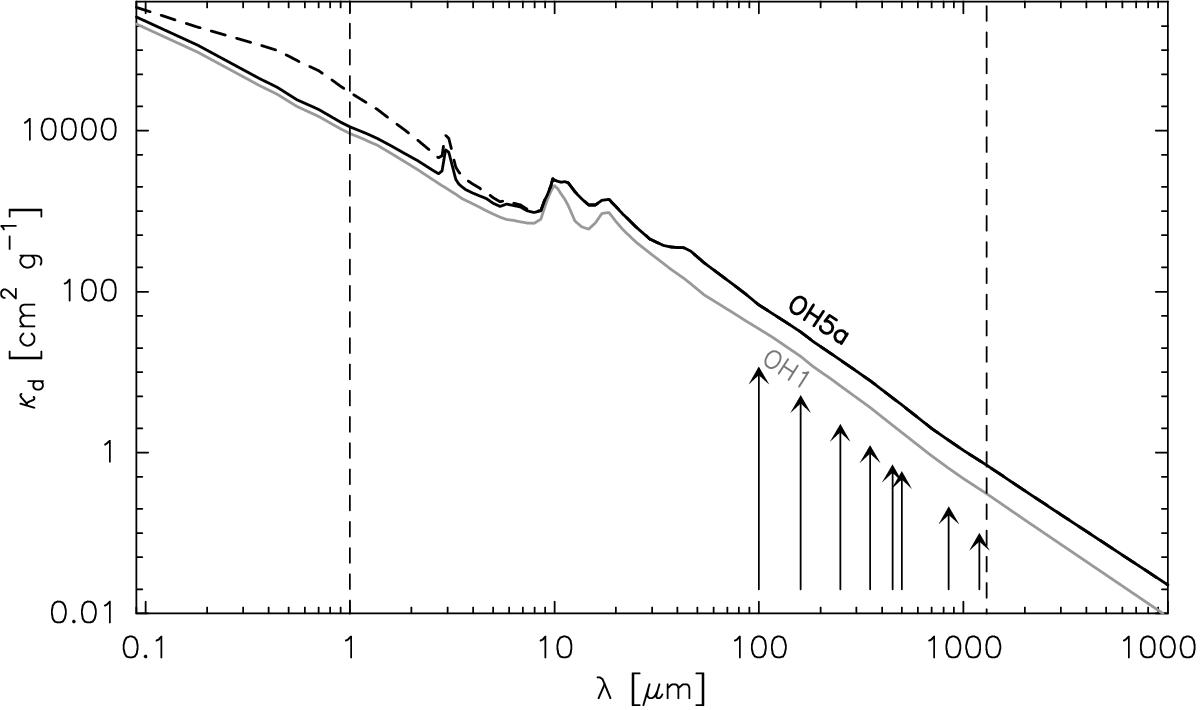
Dust opacity models (extinction/absorption coefficient per g of dust) used in this paper. Black lines show the absorption (solid) and extinction (dashed) coefficients of the modified OH5a model (Ossenkopf & Henning 1994). The gray line shows the OH1 model (see Sect. 5.1.3; for clarity, only the absorption coefficient spectrum is shown). Vertical dashed lines mark the wavelength range of the original OH models, i.e., values outside this range are extrapolated (see text). Arrows indicate the wavelength bands of the dust emission data used in this paper.
Current usage metrics show cumulative count of Article Views (full-text article views including HTML views, PDF and ePub downloads, according to the available data) and Abstracts Views on Vision4Press platform.
Data correspond to usage on the plateform after 2015. The current usage metrics is available 48-96 hours after online publication and is updated daily on week days.
Initial download of the metrics may take a while.