Fig. A.2
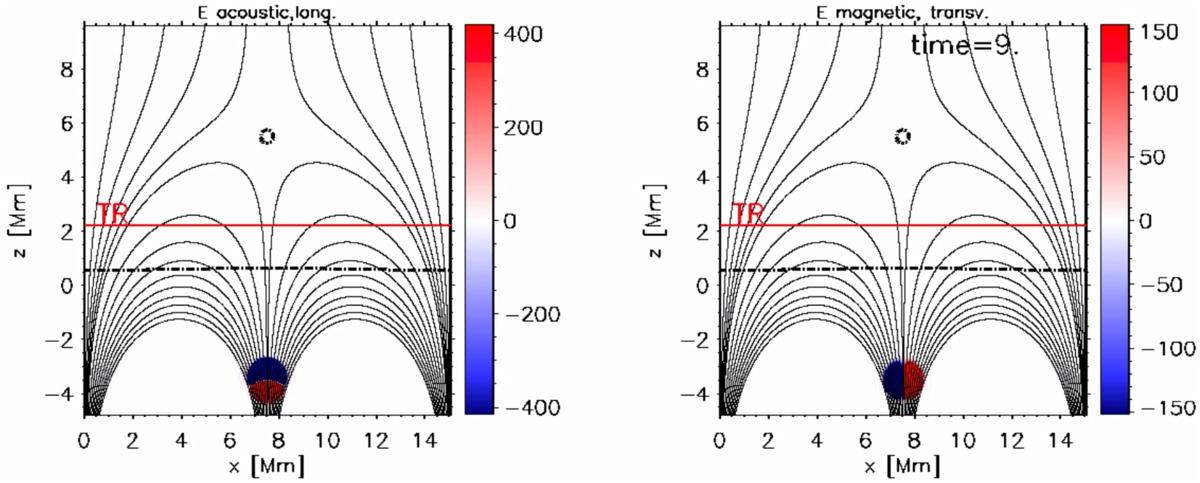
Attached movie shows the nonlinear wave propagation by means of acoustic (left panel) and magnetic (right panel) energy flux proxies. These quantities are the same as shown in Figs. 1 and 2 and the units are given in ![]() . The equipartition layers (β = 1 layer) are indicated with black dashed lines, while the transition region is shown with a red solid line.
. The equipartition layers (β = 1 layer) are indicated with black dashed lines, while the transition region is shown with a red solid line.
Current usage metrics show cumulative count of Article Views (full-text article views including HTML views, PDF and ePub downloads, according to the available data) and Abstracts Views on Vision4Press platform.
Data correspond to usage on the plateform after 2015. The current usage metrics is available 48-96 hours after online publication and is updated daily on week days.
Initial download of the metrics may take a while.