Fig. 3
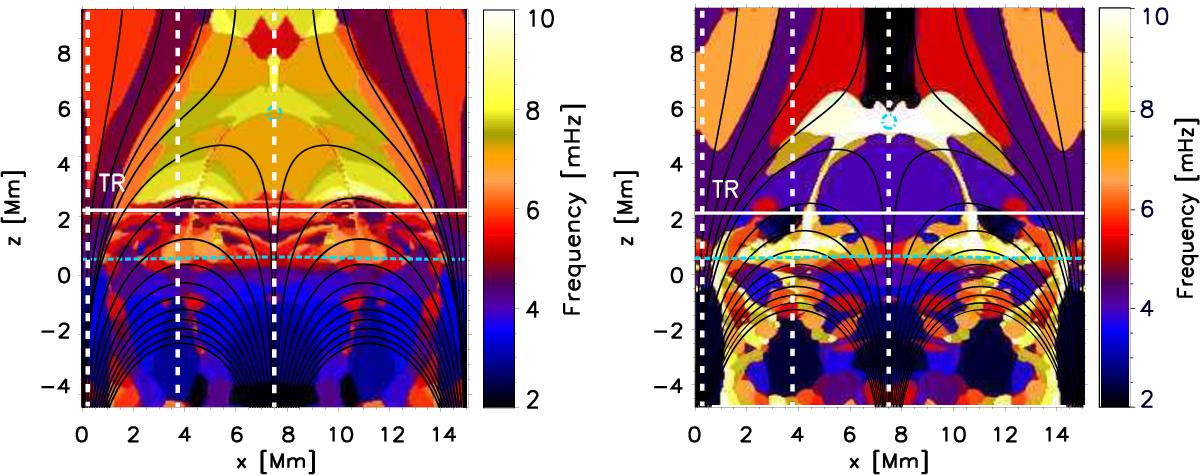
Spatial distribution of the dominant frequencies of the vertically propagating waves for a maximum frequency of 10 mHz for (left) linear and (right) nonlinear regimes. Dashed blue lines denote β = 1 contours, white solid horizontal lines indicate the transition region and black solid lines indicate magnetic field lines. The vertical white dashed lines indicate the vertical slices for which the time-height diagrams are shown in Figs. 1 and 2.
Current usage metrics show cumulative count of Article Views (full-text article views including HTML views, PDF and ePub downloads, according to the available data) and Abstracts Views on Vision4Press platform.
Data correspond to usage on the plateform after 2015. The current usage metrics is available 48-96 hours after online publication and is updated daily on week days.
Initial download of the metrics may take a while.