Fig. 1
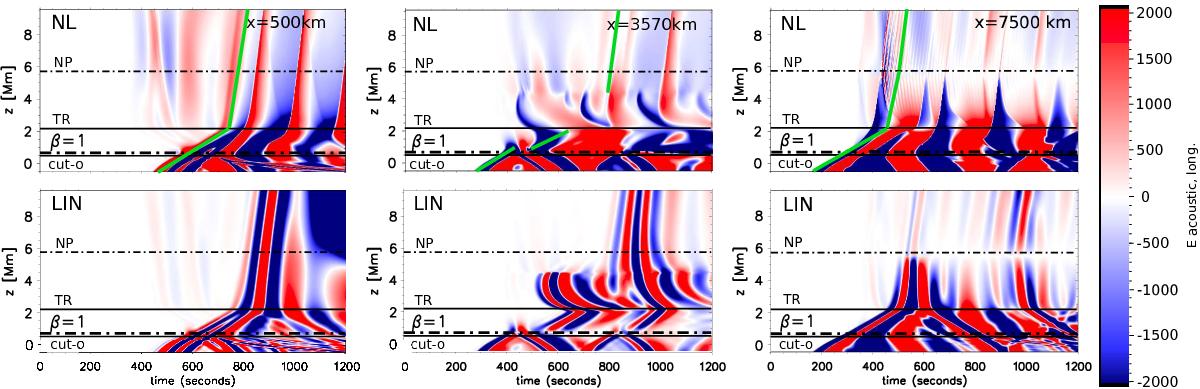
Perturbation of the acoustic energy flux proxy in the direction parallel to the magnetic field for three different horizontal positions: left x = 500 km, inside the vertical flux tubes; middle x = 3750 km, in the middle of the arcades where the magnetic field is mostly horizontal; and right x = 7500 km, in the middle of the domain where the null point is located. Upper row: nonlinear case, bottom row: linear case. The energy proxy is given in ![]() . The plots were scaled to the corresponding amplitude of the pressure driver so that the colors in each figure can be directly compared. Overplotted green lines in the upper panels show the slopes on the linear fronts to compare both regimes more directly.
. The plots were scaled to the corresponding amplitude of the pressure driver so that the colors in each figure can be directly compared. Overplotted green lines in the upper panels show the slopes on the linear fronts to compare both regimes more directly.
Current usage metrics show cumulative count of Article Views (full-text article views including HTML views, PDF and ePub downloads, according to the available data) and Abstracts Views on Vision4Press platform.
Data correspond to usage on the plateform after 2015. The current usage metrics is available 48-96 hours after online publication and is updated daily on week days.
Initial download of the metrics may take a while.