Fig. 1
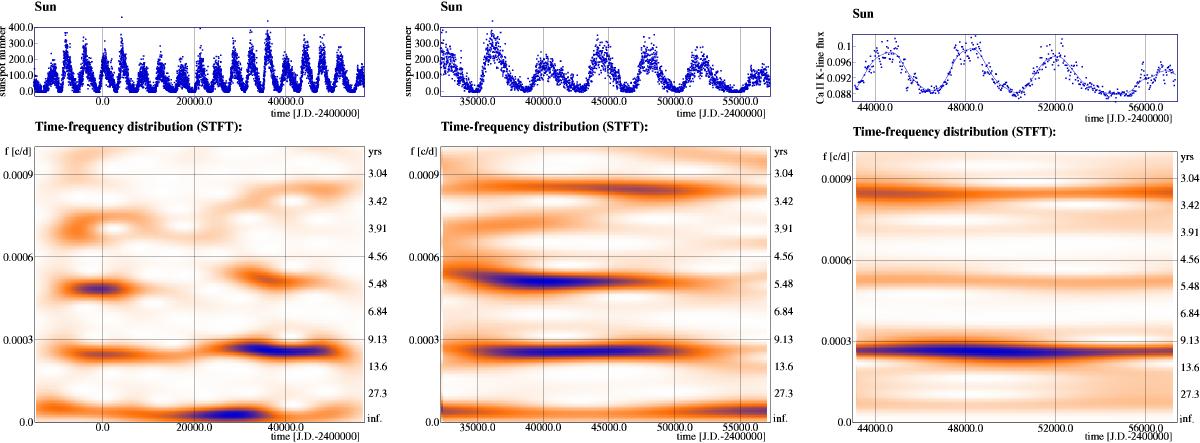
Solar data (upper panels) and STFT calculations (lower panels). Left: sunspot number data from 1818 to the present and STFT. The Gleissberg cycle is shown in the bottom of the figure; above this is the Schwabe (11 yr) cycle, and above this, its half and one-third harmonic cycles are also found. Additionally, and mixed with the one-third of the Schwabe cycle, another changing variation of 3–4 yr is continuously present in the data. Middle: STFT of a shorter record of sunspot number (1947 to present) and right: the same for the Ca ii K flux of the Sun between 1976–2015. The variability of 3−4 yr is also well detected in the two shorter datasets.
Current usage metrics show cumulative count of Article Views (full-text article views including HTML views, PDF and ePub downloads, according to the available data) and Abstracts Views on Vision4Press platform.
Data correspond to usage on the plateform after 2015. The current usage metrics is available 48-96 hours after online publication and is updated daily on week days.
Initial download of the metrics may take a while.