Fig. 9
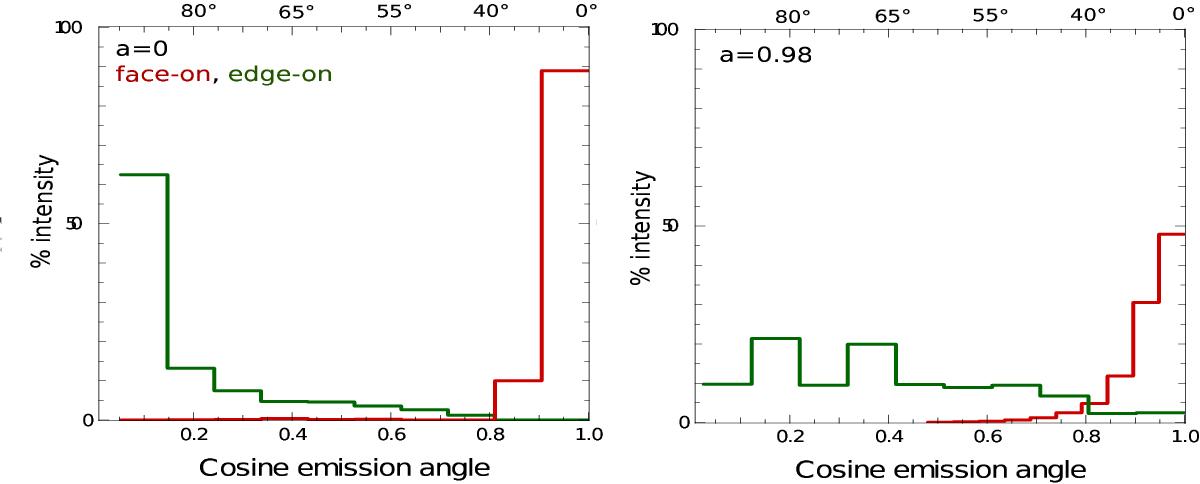
Specific intensity distribution with emission angle. This figure shows the histogram of specific intensity emitted at the surface of the disk in percentage of the total intensity as a function of cosi. This total intensity is defined simply as the sum of the specific intensity map over all pixels. It is thus proportional to the total observed flux.The spin is 0on the left and 0.98on the right. The inclination is face-on in red, edge-on in green.
Current usage metrics show cumulative count of Article Views (full-text article views including HTML views, PDF and ePub downloads, according to the available data) and Abstracts Views on Vision4Press platform.
Data correspond to usage on the plateform after 2015. The current usage metrics is available 48-96 hours after online publication and is updated daily on week days.
Initial download of the metrics may take a while.