Fig. 8
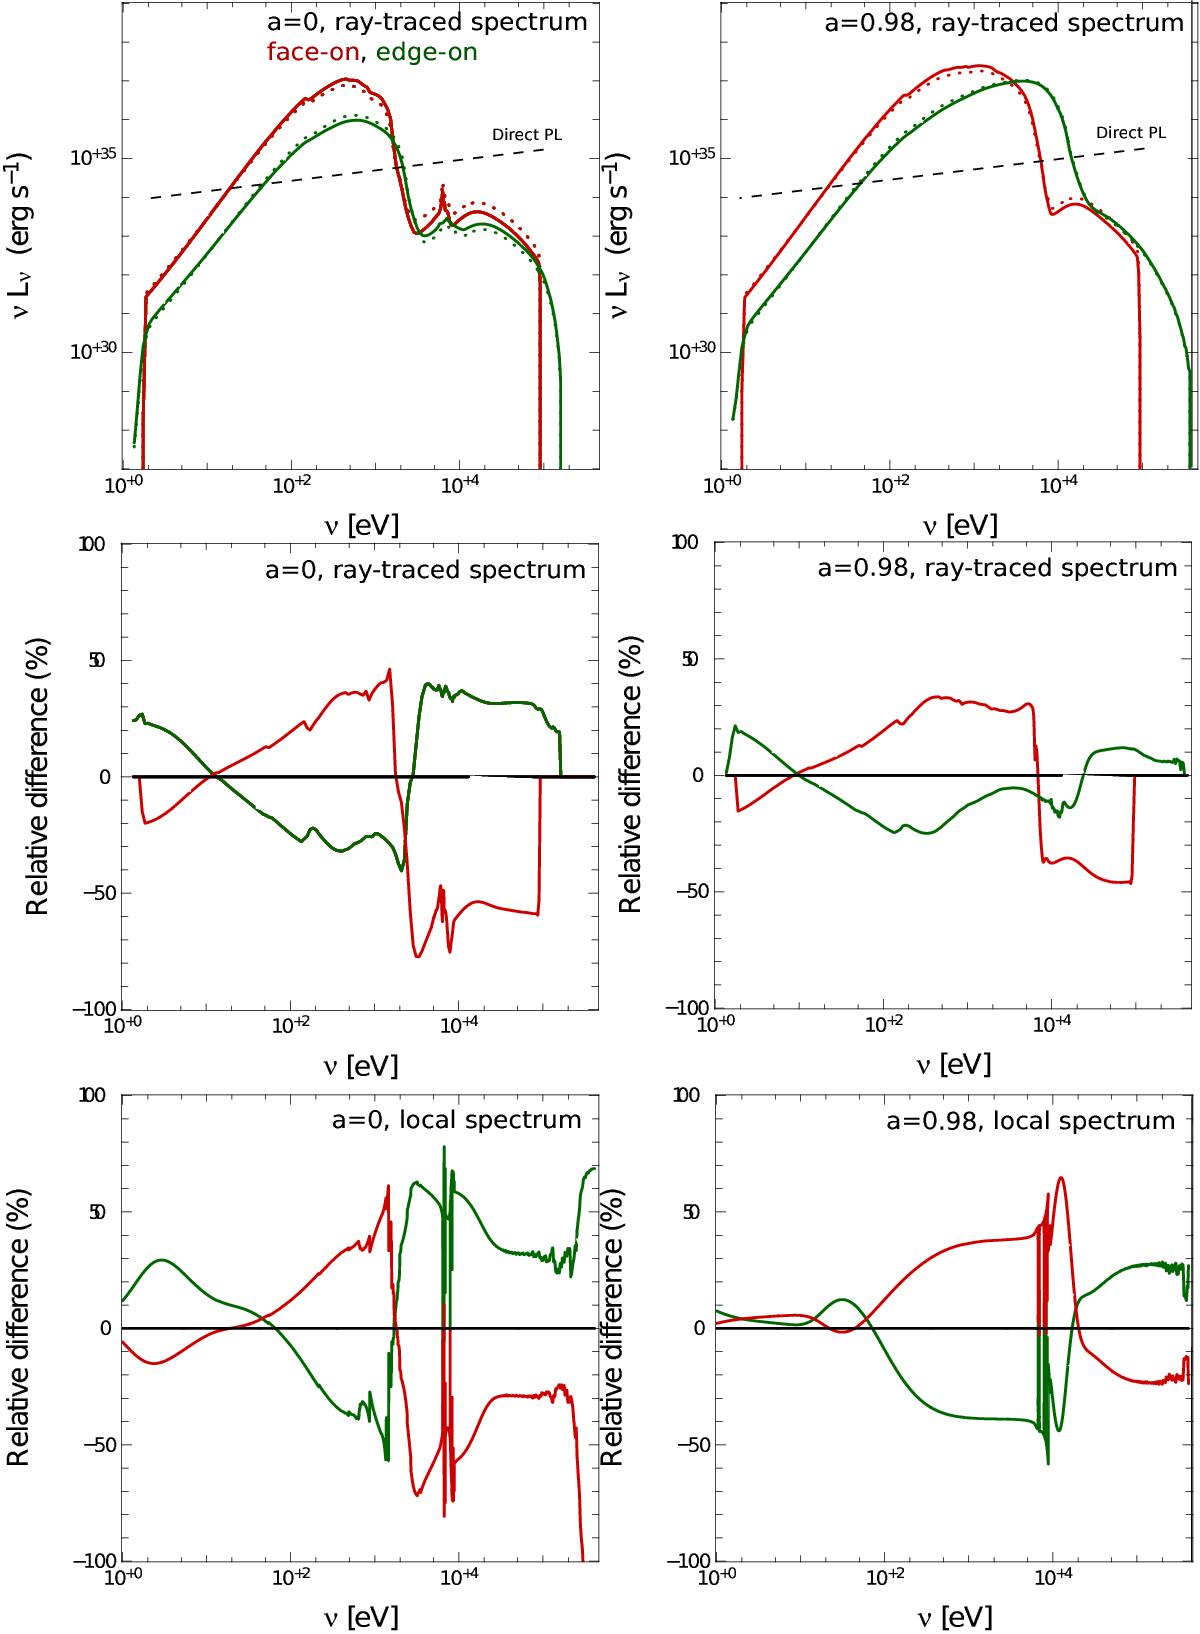
Ray-traced νLν spectra: impact of directionality. The local spectra were computed with GR illumination. The top row shows emission-angle-averaged (dotted) and angle-dependent (solid) ray-traced spectra. The straight black dashed line shows the level of the direct-component power law (see text for details). The middle row shows the relative difference between averaged and angle-dependent ray-traced spectra. The bottom row shows the same quantity as the middle row for the local spectra, evaluated at r = rmin. The spin is 0 (left column) or 0.98 (right column). Red curves refer to spectra ray traced from an inclination of θ = 5°, i.e., close to face-on. Green curves are computed at an inclination of θ = 85°, i.e., close to edge-on. “Face-on” and “edge-on” in the two upper rows (ray-traced quantities) refer to the inclination angle θ, while in the bottom row (local quantities) these words refer to the emission angle i.
Current usage metrics show cumulative count of Article Views (full-text article views including HTML views, PDF and ePub downloads, according to the available data) and Abstracts Views on Vision4Press platform.
Data correspond to usage on the plateform after 2015. The current usage metrics is available 48-96 hours after online publication and is updated daily on week days.
Initial download of the metrics may take a while.