Fig. 7
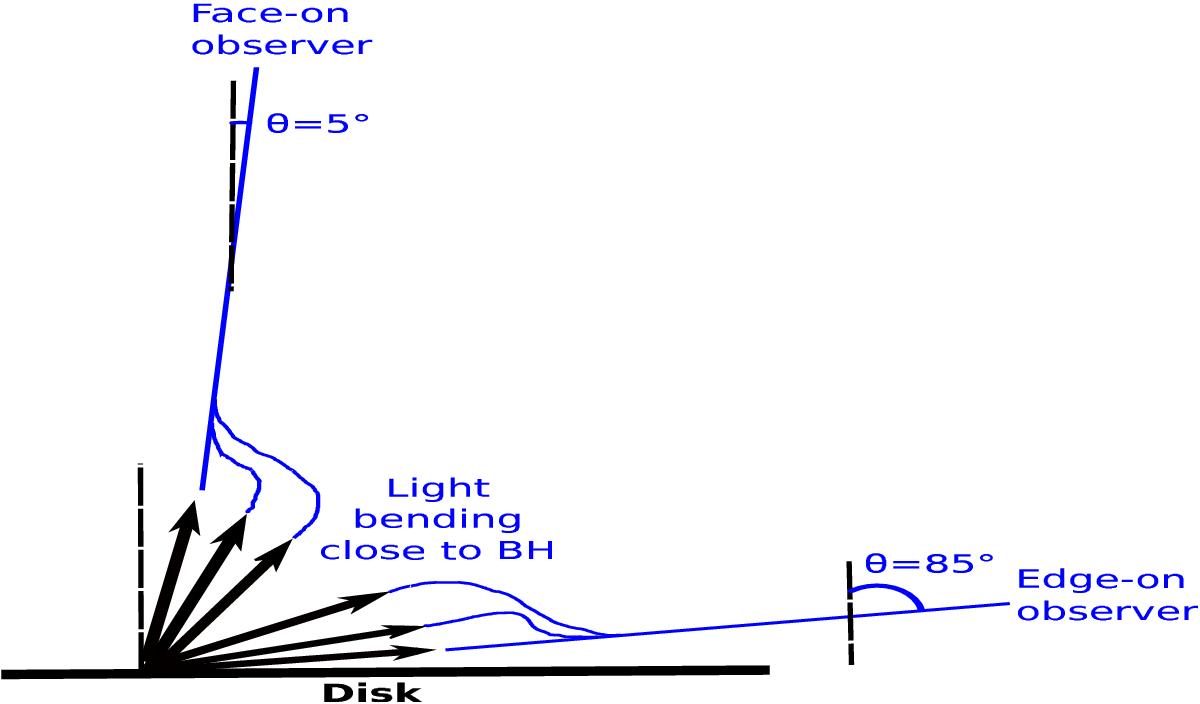
Illustrating the angle dependence of ray-traced spectra. Ray-traced spectra in this article are computed from two inclination angles, θ = 5° (face-on observer) or θ = 85° (edge-on observer). From each of this inclination angles, photons are ray-traced backward to the accretion disk (blue lines). For one given inclination θ, photons reach the disk with a set of different directions because of light bending. This is illustrated in the figure by the fact that one given blue line is connected to a set of different directions of local emission in the disk (black arrows, the black vertical dashed line is the local normal). Directional ray-traced spectra are computed by transporting along each geodesic the specific intensity Iν(r,i) emitted at the local position r in the direction i of this particular geodesic. Angle-averaged, ray-traced spectra are computed by transporting along each geodesic the angle-averaged specific intensity Iν(r) obtained by averaging Iν(r,i) over all emission angles i.
Current usage metrics show cumulative count of Article Views (full-text article views including HTML views, PDF and ePub downloads, according to the available data) and Abstracts Views on Vision4Press platform.
Data correspond to usage on the plateform after 2015. The current usage metrics is available 48-96 hours after online publication and is updated daily on week days.
Initial download of the metrics may take a while.