Fig. 4
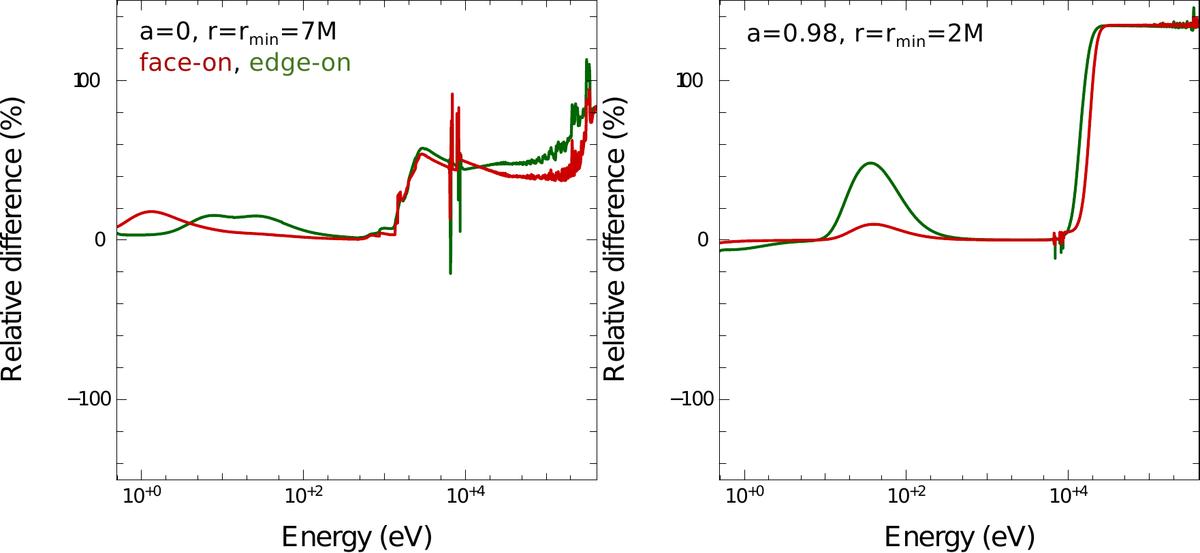
Local νIν spectra: relative difference at rmin for GR/Newtonian illuminations. The red curve shows the relative difference between the local spectrum computed with GR or Newtonian illuminations in the face-on direction. The green curve shows the same quantity for the edge-on direction. Spin is 0 on the left panel and 0.98 on the right panel. The spectrum is computed in both cases at r = rmin.
Current usage metrics show cumulative count of Article Views (full-text article views including HTML views, PDF and ePub downloads, according to the available data) and Abstracts Views on Vision4Press platform.
Data correspond to usage on the plateform after 2015. The current usage metrics is available 48-96 hours after online publication and is updated daily on week days.
Initial download of the metrics may take a while.