Fig. 8
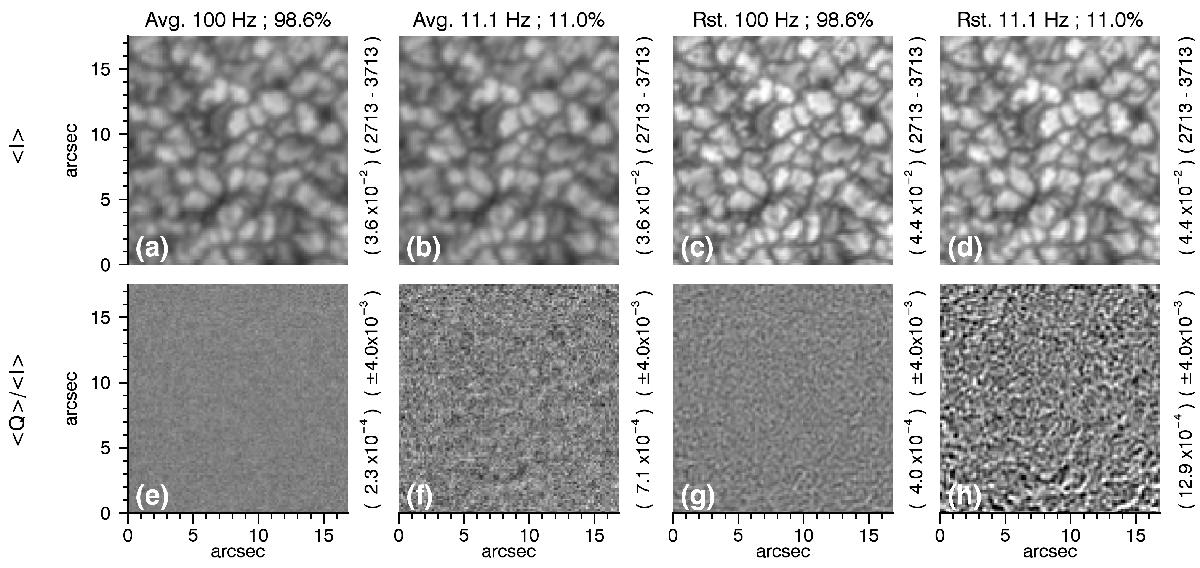
Effects of the modulation frequency, duty cycle and image restoration (labeled on top of each column) on the SIC level in Stokes Q images. The Stokes I (upper row) and the normalized Stokes Q (bottom row) are shown for the data sets with 100 and 11.1 Hz modulation frequency presented in Fig. 6. Both a plain average, covering 1.16 min wall time a), b), e), and f), and the corresponding MOMFBD-restored versions c), d), g), and h) are presented. The original plate scale of the images is 0.08 arcsec/pixel in both directions. However they have been binned using a 2 × 2 pixel2 window. The figures in parentheses in the right border of each image denote its grayscale range (upper panels) and standard deviation, or rms contrast for Stokes I, computed across the images (lower panels).
Current usage metrics show cumulative count of Article Views (full-text article views including HTML views, PDF and ePub downloads, according to the available data) and Abstracts Views on Vision4Press platform.
Data correspond to usage on the plateform after 2015. The current usage metrics is available 48-96 hours after online publication and is updated daily on week days.
Initial download of the metrics may take a while.