Fig. 6
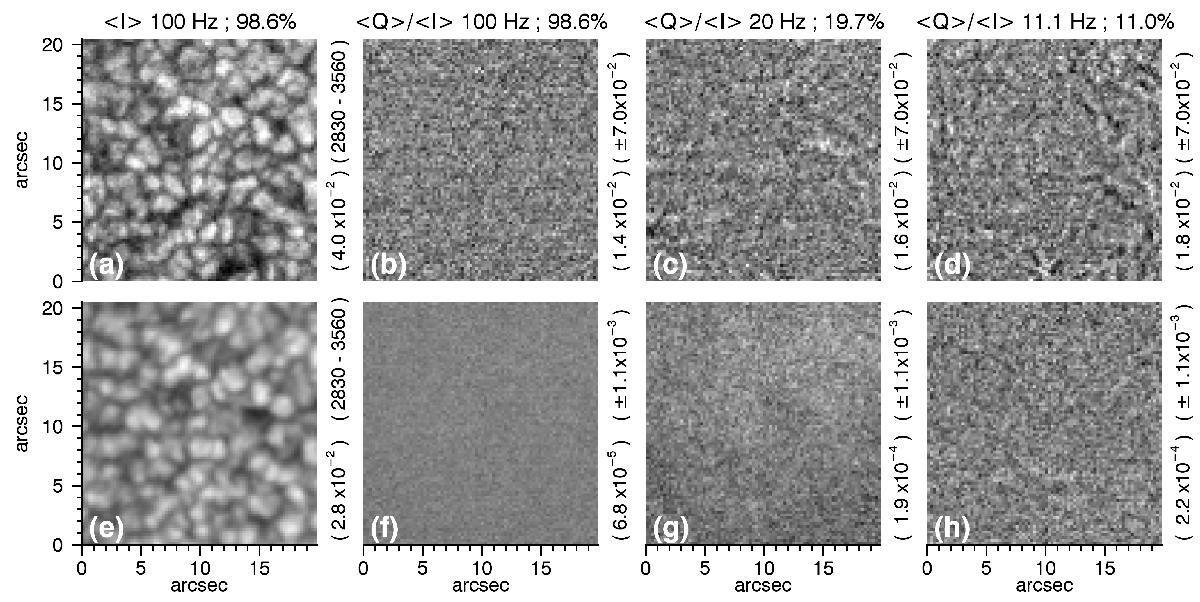
Seeing-induced crosstalk in a normalized Stokes Q image, for different modulation frequencies, duty cycles (labeled on top of each column) and number of averaged measurements (rows). These quiet Sun images were acquired with FSP modulator package disconnected, i.e. in a situation where no solar polarization signal is expected, using the VTT/TESOS filtergraph tuned to the continuum at –280 mÅ from the line core of Fe I, 630.25 nm. The upper row presents Stokes Ia) and the normalized Stokes Qb), c) and d) of a single measurement. The lower row shows the results after averaging 45 989 e) and f), 9 160 g) and 5 060 h) Stokes images, all covering 7.66 min wall time, approximately. The 20 and 11.1 Hz cases were obtained by eliminating intermediate intensity measurements from the 100 Hz case before demodulation (see the text for details on this procedure). The original plate scale of the images is 0.08 arcsec/pixel in both directions. However they have been binned using a 3 × 3 pixel2 window. The figures in parentheses on the right border of each image denote its grayscale range (upper figure) and standard deviation, or rms contrast for Stokes I, computed across the sensor area (lower figure).
Current usage metrics show cumulative count of Article Views (full-text article views including HTML views, PDF and ePub downloads, according to the available data) and Abstracts Views on Vision4Press platform.
Data correspond to usage on the plateform after 2015. The current usage metrics is available 48-96 hours after online publication and is updated daily on week days.
Initial download of the metrics may take a while.