Fig. 5
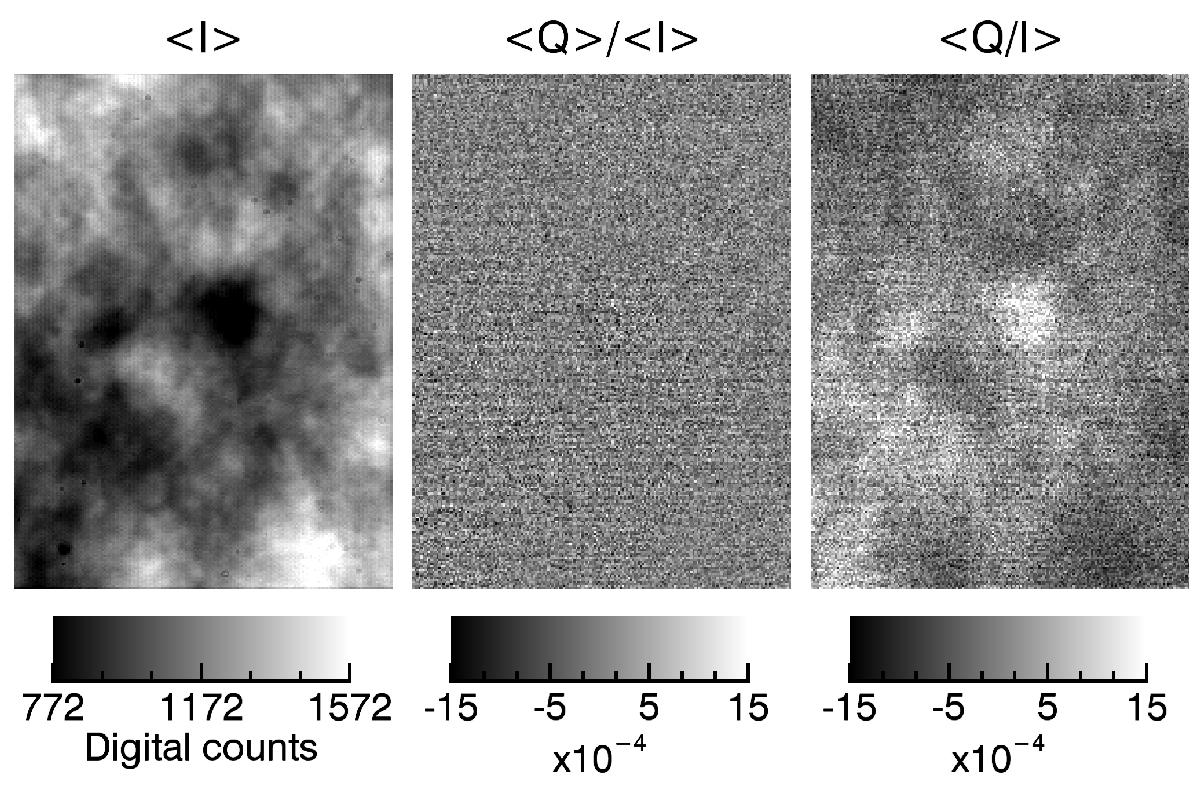
Average of nearly 5× 10⁴ (8.3 min) FSP measurements acquired with the modulator package disconnected. Only a fraction of the sensor area is shown. The contrast of the averaged, non-flat-fielded Stokes I image (⟨ I ⟩) is practically dominated by the etalons cavity errors. The difference of the artifact introduced by the bias term of Eq. (2), is evident in the Stokes Q images that were accumulated and then normalized (⟨ Q ⟩/⟨ I ⟩) and vice versa (⟨ Q/I ⟩).
Current usage metrics show cumulative count of Article Views (full-text article views including HTML views, PDF and ePub downloads, according to the available data) and Abstracts Views on Vision4Press platform.
Data correspond to usage on the plateform after 2015. The current usage metrics is available 48-96 hours after online publication and is updated daily on week days.
Initial download of the metrics may take a while.