Fig. 3
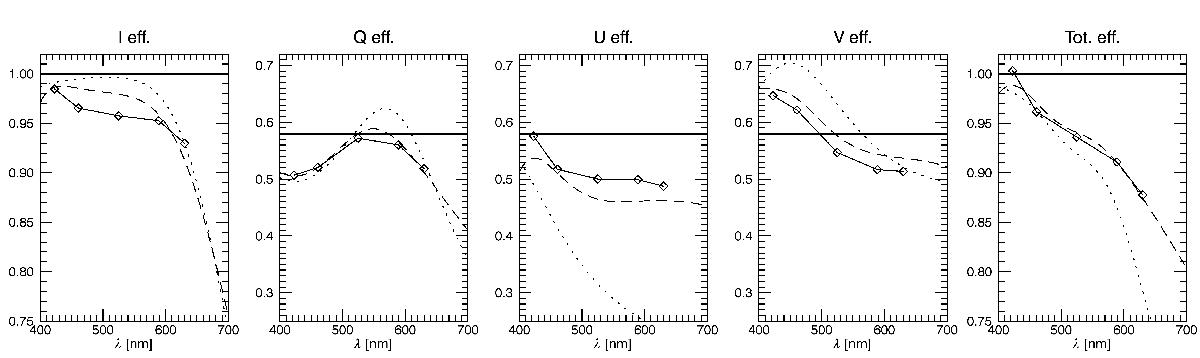
Measured (diamonds), ideal (thick continuous) and modeled FSP polarimetric efficiencies vs. wavelength. The results of the numerical modulator model are presented for two different configurations, one using the values listed in Table 2 (dashed) and the second using the same input, except that the values of the dispersion coefficients, Cd, were all set to zero (dotted). The large differences of the latter, with respect to the measured values, particularly in Stokes U, emphasize the necessity of a detailed model of the retardances’ dispersion to properly reproduce the spectral response of the modulator. The ideal efficiencies are the maximum achievable by a perfectly balanced and achromatic system.
Current usage metrics show cumulative count of Article Views (full-text article views including HTML views, PDF and ePub downloads, according to the available data) and Abstracts Views on Vision4Press platform.
Data correspond to usage on the plateform after 2015. The current usage metrics is available 48-96 hours after online publication and is updated daily on week days.
Initial download of the metrics may take a while.