Fig. 7
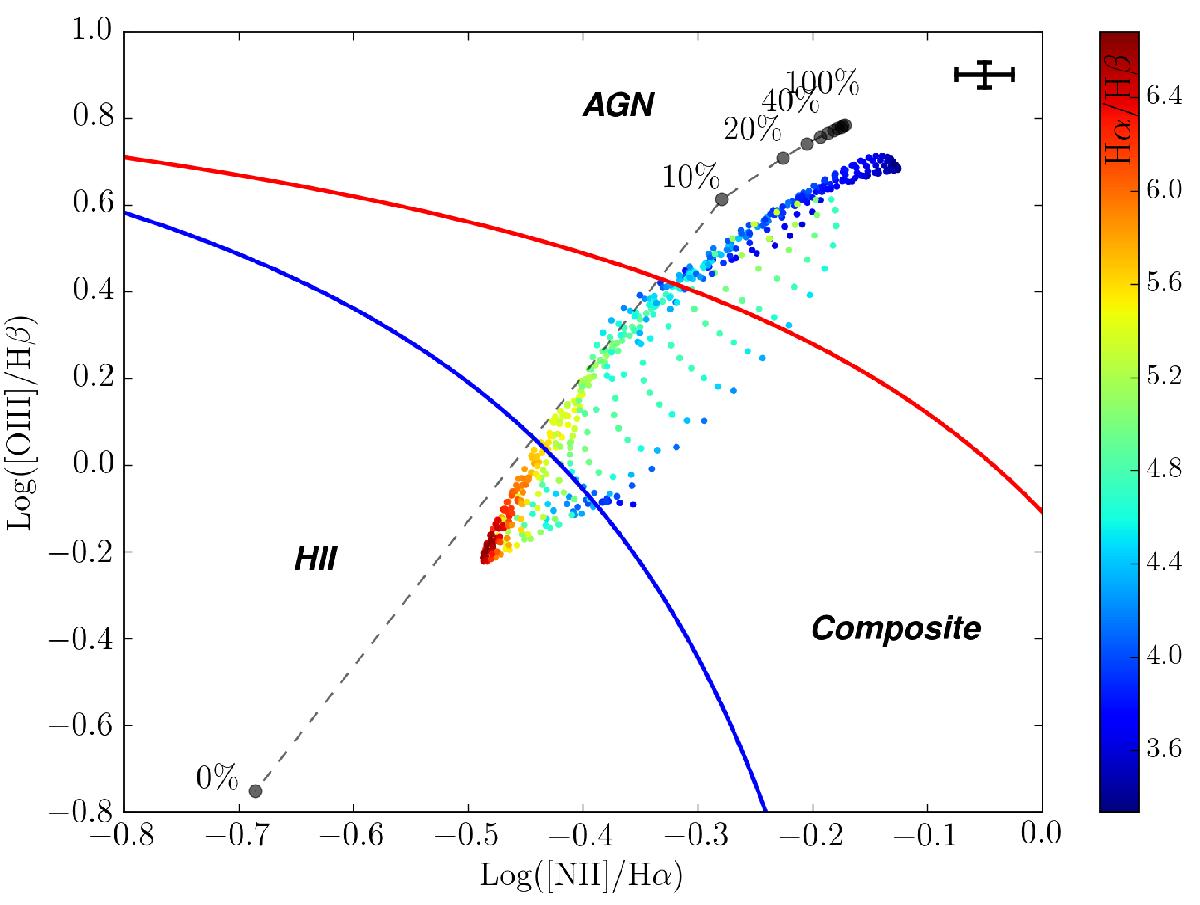
[O iii]λ5007/Hβ vs. [N ii]λ6584 /Hα diagnostic diagram showing the mixing line color coded based on the Balmer decrement. The solid red and blue lines are the lines by Kewley et al. (2001) and Kauffmann et al. (2003) respectively. The models are outlined with the black filled circles and connected with the dashed black line. The point with the lower line ratios is the 100% black body model while the one with highest line ratios is the 100% AGN model. The fractional contribution of the AGN to the total amount of ionizing light is indicated for the models with 0-10-20-40-100% AGN fraction.
Current usage metrics show cumulative count of Article Views (full-text article views including HTML views, PDF and ePub downloads, according to the available data) and Abstracts Views on Vision4Press platform.
Data correspond to usage on the plateform after 2015. The current usage metrics is available 48-96 hours after online publication and is updated daily on week days.
Initial download of the metrics may take a while.