Fig. 6
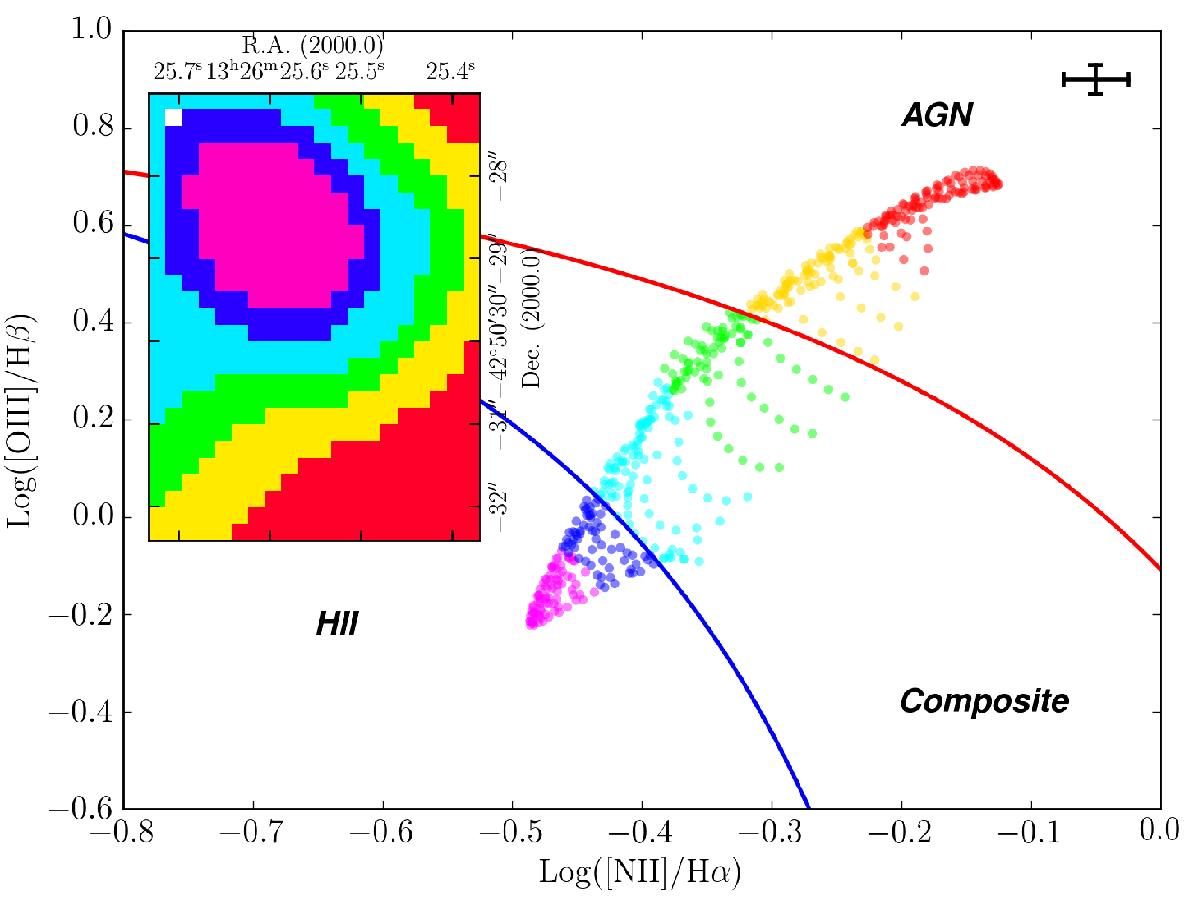
[O iii]λ5007/Hβ vs. [N ii]λ6584 /Hα diagnostic diagram showing the points related to the mixing line. The solid red and blue lines are the lines by Kewley et al. (2001) and Kauffmann et al. (2003) respectively. The insert in the top-left corner of the diagram is the pixel map related to the mixing sequence. The color coding of the points follows the same approach used for Fig. 2.
Current usage metrics show cumulative count of Article Views (full-text article views including HTML views, PDF and ePub downloads, according to the available data) and Abstracts Views on Vision4Press platform.
Data correspond to usage on the plateform after 2015. The current usage metrics is available 48-96 hours after online publication and is updated daily on week days.
Initial download of the metrics may take a while.