Fig. 5
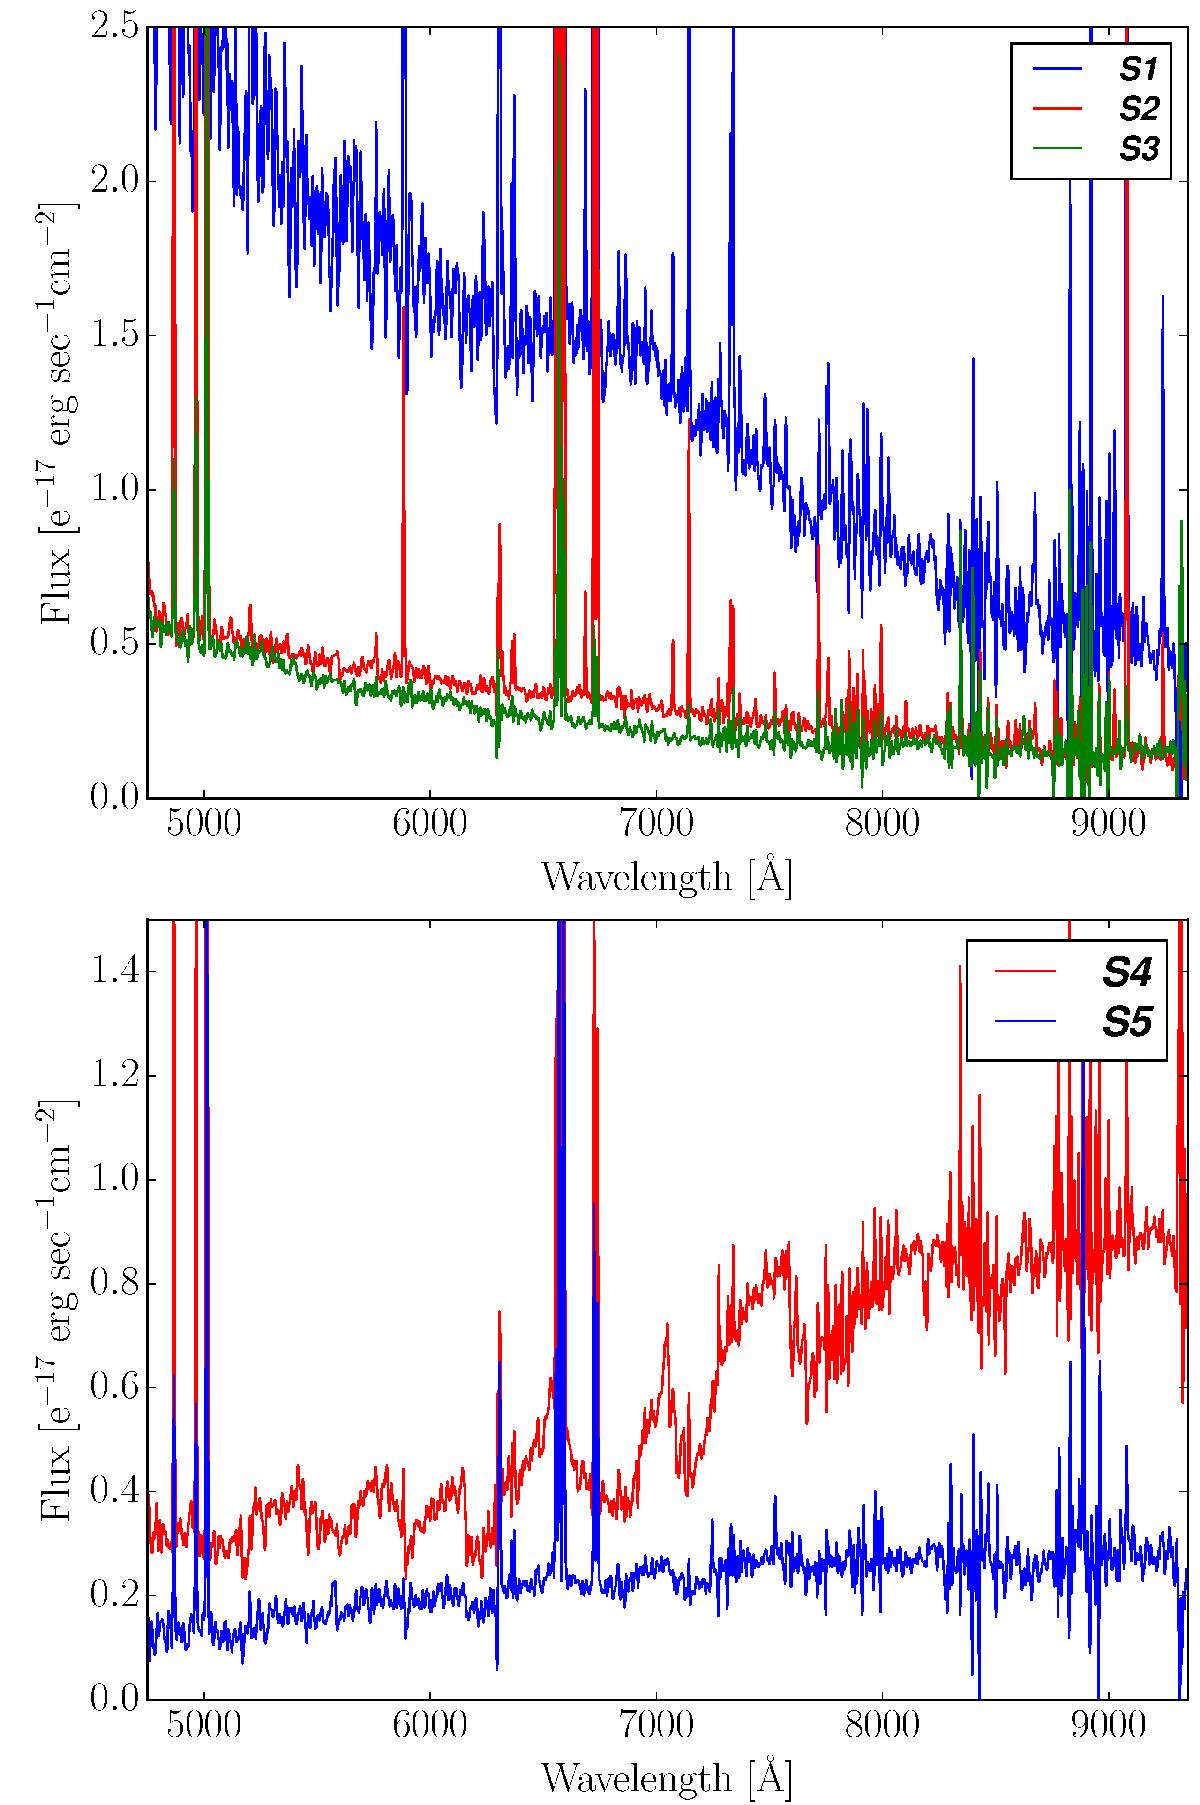
Upper panel: integrated spectra of the S1,S2 and S3 continuum sources. The spectrum of S1 has been de-reddened according to the Balmer decrement in the associated circular region. Lower panel: integrated spectra of the S4, S5 continuum sources. All the spectra are extracted from the circular regions associated with each continuum source and outlined in Fig. 4. The emission lines of the ionized gas have not been masked. Some residuals of the sky subtraction are evident in the red end of the spectra.
Current usage metrics show cumulative count of Article Views (full-text article views including HTML views, PDF and ePub downloads, according to the available data) and Abstracts Views on Vision4Press platform.
Data correspond to usage on the plateform after 2015. The current usage metrics is available 48-96 hours after online publication and is updated daily on week days.
Initial download of the metrics may take a while.