Fig. 4
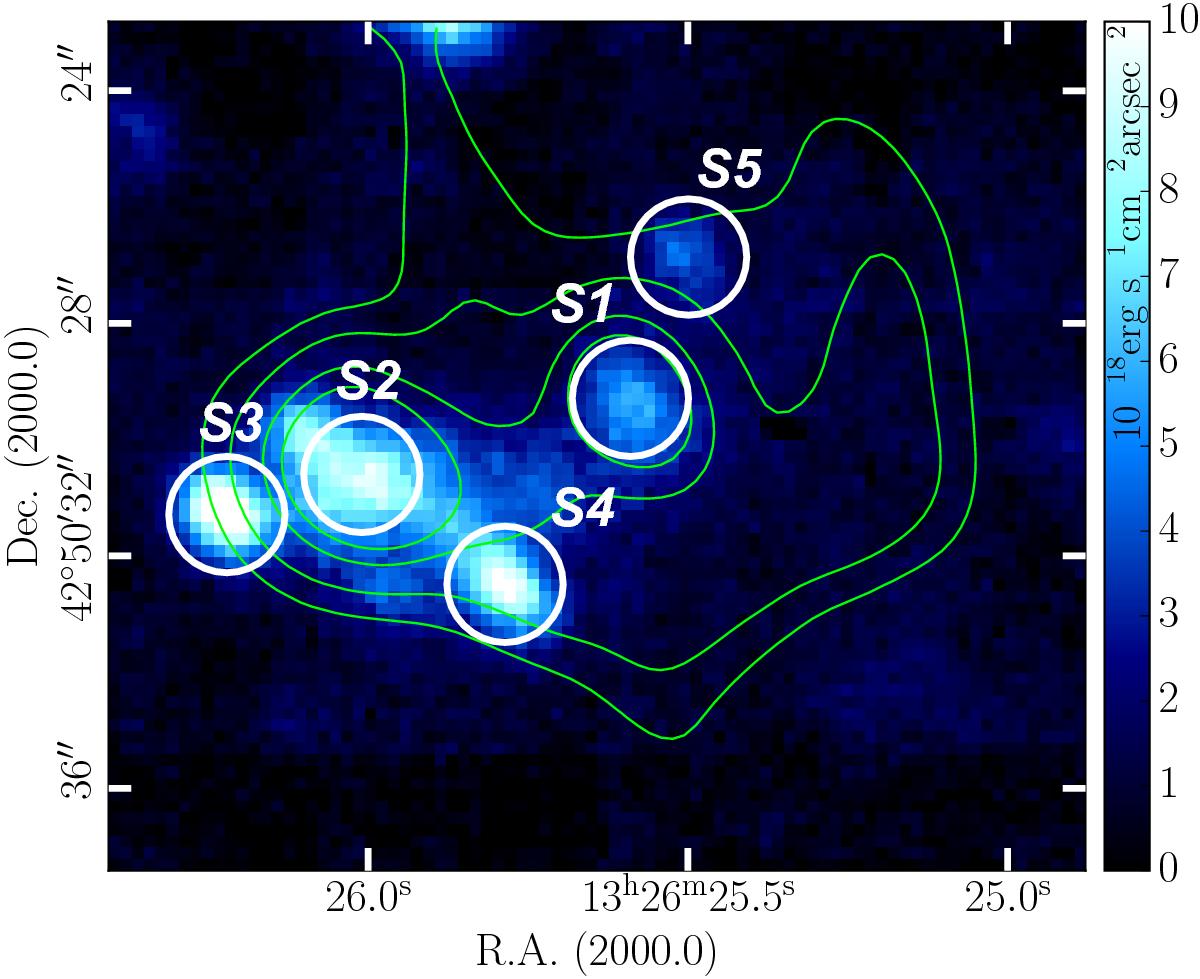
Continuum image obtained integrating the emission across the region in the wavelength range 4750−6650 Å masking line emission by the ionized gas. The position and the names of the five continuum sources are indicated in white. Hα intensity contours are overplotted in green. Contour levels are 2.98, 1.89, 0.75, 0.33 × 10⁻¹⁶ erg s-1cm-2 arcsec-2.
Current usage metrics show cumulative count of Article Views (full-text article views including HTML views, PDF and ePub downloads, according to the available data) and Abstracts Views on Vision4Press platform.
Data correspond to usage on the plateform after 2015. The current usage metrics is available 48-96 hours after online publication and is updated daily on week days.
Initial download of the metrics may take a while.